


General
TMS for Production Line-Down Risk: Why a Late Delivery Means Something Different in Manufacturing in 2026

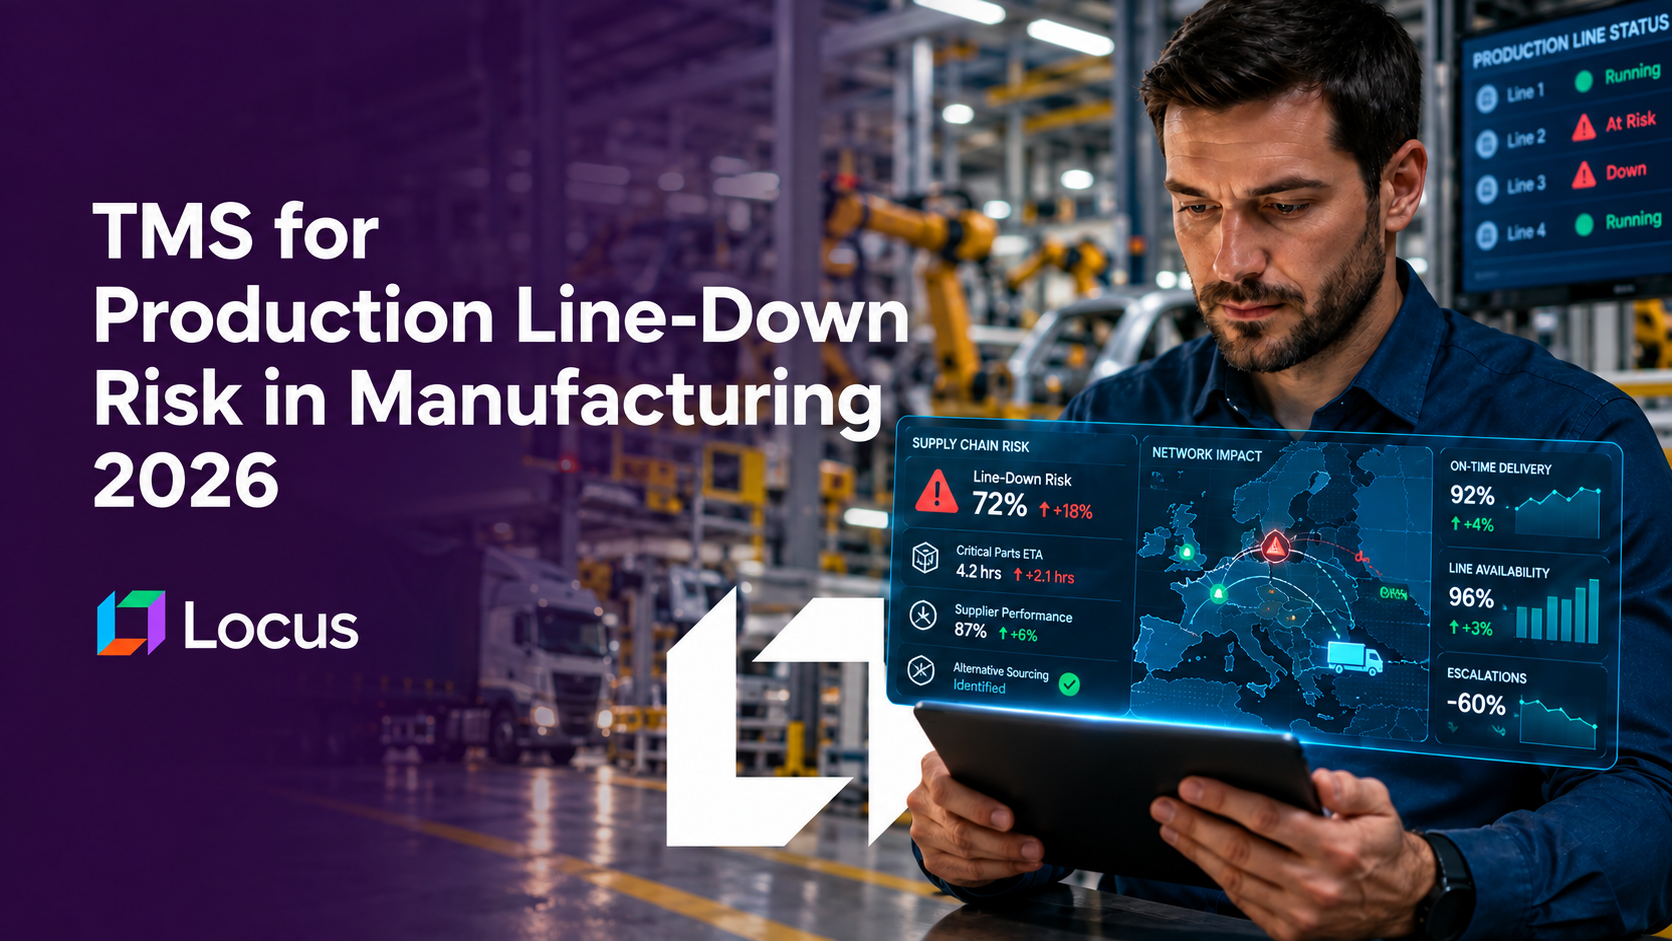
A TMS built for production line-down risk prioritizes inbound shipments by what stopping would cost the receiving plant, not by how overdue the shipment already is, because a manufacturer’s inbound logistics problem is fundamentally different from a retailer’s or a distributor’s. A late customer delivery costs a fulfillment network a missed SLA and a support ticket. A late raw-material or component delivery to a manufacturing plant can cost an idle assembly line, idle labor, idle capital equipment and a cascading schedule disruption across every downstream station the stopped one feeds. Most inbound logistics software, including most general-purpose TMS platforms, was built around the first cost structure and applied without modification to the second. Locus, the world’s first Decision-Intelligent, Agentic TMS, treats line-down risk as its own prioritization input, distinct from standard lateness, because the two are not the same problem with different numbers attached, they are different problems.
Key Takeaways
- Unplanned production downtime in automotive manufacturing is widely cited at roughly $22,000 a minute, with specific stoppages that back up welding, paint and final assembly running higher, a cost structure with no equivalent in standard delivery lateness.
- Across the broader US manufacturing sector, unplanned downtime costs an estimated $50 billion a year, and the cost per hour has risen roughly 50 percent since 2019.
- A standard TMS prioritizes inbound shipments by how late they already are. A line-down-risk-aware TMS prioritizes by what a shipment’s lateness would cost if it actually stops a line, a different ranking entirely.
- The two failure modes are asymmetric: a false sense of urgency wastes expediting spend, while a missed line-down risk can cost more in one stopped hour than a year of inbound savings.
- On Locus, inbound shipments are evaluated against the specific production schedule and line they feed, so the system can tell the difference between late and about to stop a line.
Why Line-Down Risk Is a Different Problem: The Business Case
Inbound logistics software overwhelmingly inherited its prioritization logic from outbound delivery: the shipment closest to breaching its promised window gets attention first. That logic is reasonable when the cost of lateness is roughly proportional to how late a shipment is. It breaks down for manufacturing inbound logistics, where the cost of a specific late shipment depends far more on what it feeds than on how overdue it is.
The scale of that cost asymmetry is well documented in industrial engineering and manufacturing operations research. Unplanned production downtime in automotive manufacturing is widely benchmarked at roughly $22,000 a minute, and specific stoppages that cascade backward into welding, paint and final assembly stations have been estimated meaningfully higher than that average. Across the broader US manufacturing sector, unplanned downtime is estimated to cost around $50 billion annually, and the cost per hour of downtime has risen approximately 50 percent since 2019 as production lines have grown more automated and interdependent. None of that cost structure exists in a standard last-mile delivery context, where a late shipment produces a missed SLA and a customer service interaction, not an idle assembly line.
This is why applying a generic lateness-ranked prioritization model to manufacturing inbound logistics is a category error, not just a suboptimal configuration. A shipment running two hours behind schedule that feeds a buffer-stocked, low-criticality process is a minor issue. A shipment running thirty minutes behind schedule that feeds a line with no buffer and an immediate downstream dependency is a five- or six-figure-per-hour problem in the making. A system that ranks by lateness alone will routinely under-prioritize the second shipment relative to the first, because lateness, on its own, carries no information about what stopping actually costs.
The reason this gap persists is that most inbound logistics software was never built by or for people who had to answer for a stopped line. It was built around the outbound delivery problem, where the single dominant cost variable really is how late something is, and the data model follows from that assumption: a promised window, a current ETA, a lateness calculation. Retrofitting that same data model onto manufacturing inbound logistics does not just under-serve the line-down use case, it actively produces a confident, precise-looking priority ranking that is wrong in exactly the cases where being wrong is most expensive. A dashboard that ranks shipments cleanly by minutes-late looks like it is doing its job right up until the moment a line stops on a shipment that was sitting in the middle of that ranking, not the top.
| Also Read: Manufacturing Logistics Solutions |
|---|
How a Line-Down-Risk-Aware TMS Works
Step 1: Map each inbound shipment to the specific line and station it feeds
Before risk can be prioritized correctly, the system needs to know which production line, and ideally which specific station on that line, a given inbound shipment is destined for, not just which plant or dock it is heading to.
Step 2: Encode each line’s buffer depth as a constraint
A line with four hours of buffer stock for a given component tolerates a delay very differently than a line running with thirty minutes of buffer. The system needs this buffer depth as a live input, not a static assumption set once and left unchecked.
Step 3: Translate downtime cost into a per-shipment priority score
Using the plant’s own downtime cost data, the system converts a shipment’s lateness, combined with the line’s remaining buffer, into an actual cost-weighted priority score, rather than a generic urgency flag based only on time remaining before the promised delivery window.
Step 4: Re-rank continuously as conditions change
A shipment’s line-down risk is not fixed at dispatch. A production schedule change, a line-speed adjustment, or a buffer consumption rate different from plan all change the risk calculation in real time, and the system needs to re-rank shipments accordingly rather than relying on a priority set once at the start of the day.
Step 5: Escalate line-down-risk shipments through a distinct expediting path
Once a shipment crosses into genuine line-down risk, it needs a different response than standard lateness, carrier reassignment, mode upgrade, or direct routing, triggered automatically rather than waiting for the same manual escalation process used for an ordinary delayed shipment.
Step 6: Feed actual downtime outcomes back into the risk model
When a line does stop, whether the cause was a correctly flagged high-risk shipment or one the system underweighted, that outcome needs to retrain how future shipments feeding that line and station get scored.
Line-Down-Risk Prioritization vs Standard Lateness Prioritization
| Dimension | Standard lateness-ranked TMS | Line-down-risk-aware TMS |
|---|---|---|
| Priority basis | How overdue a shipment already is | What stopping production would cost if the shipment does not arrive in time |
| Data required | Promised delivery window, current ETA | Promised window, current ETA, destination line, line buffer depth, downtime cost |
| Typical failure mode | A high-cost, moderately late shipment is outranked by a low-cost, severely late one | Requires accurate, current buffer and downtime data, or the risk score itself becomes unreliable |
| Expediting trigger | A fixed lateness threshold applied uniformly | A cost-weighted threshold specific to the line and station the shipment feeds |
| Best fit | Retail and e-commerce outbound delivery, where lateness cost is roughly uniform | Manufacturing inbound logistics, where lateness cost varies by orders of magnitude depending on what is fed |
The practical risk in the right column is not the model, it is the data discipline underneath it. A line-down-risk score built on stale buffer data or an outdated downtime cost figure will misprioritize just as badly as a lateness-only model, which is why this approach only works when buffer depth and downtime cost are treated as live operational data, not a one-time configuration input.
This is also why a line-down-risk model cannot simply be bolted onto an existing lateness-ranked system as an extra filter. A filter applied on top of a lateness ranking still inherits that ranking’s blind spot, it just catches the most extreme cases rather than fixing the underlying prioritization logic. The two approaches differ at the level of what the system is actually optimizing for, not just how sensitive the alerting is, which is why treating this as a dashboard add-on rather than a change to the core prioritization model tends to produce a system that looks improved without actually closing the gap.
What to Look for in a TMS That Models Line-Down Risk
Shipment-to-line mapping as a native data model. Confirm the system can associate a specific inbound shipment with the specific production line and station it feeds, not just the receiving plant in general.
Live buffer depth as an input, not a static assumption. Ask whether the platform ingests current buffer stock levels for the components it is prioritizing against, since a stale buffer assumption produces a stale, and potentially dangerous, risk score.
Cost-weighted prioritization, not a generic urgency tier. The system should be able to rank shipments by an actual cost-weighted score derived from downtime cost and buffer depth, not a small number of fixed urgency levels applied the same way to every line.
A distinct expediting workflow for line-down-risk shipments. Confirm the platform can trigger a different response, carrier reassignment, mode upgrade, direct routing, specifically for shipments crossing into genuine line-down risk, rather than funneling every exception through the same manual process.
Continuous re-ranking as conditions change through the shift. Ask how often the system reassesses line-down risk, since a static morning priority list cannot reflect a buffer that is consumed faster than planned or a schedule that changes mid-shift.
What This Looks Like in Practice
A Fortune 50 parcel enterprise running more than 4,500 drivers across 51 sites uncovered more than $14 million in annualized operational opportunity by moving dispatch decisions into a single constraint-based system where capacity and priority were evaluated together rather than separately, the same underlying discipline a line-down-risk model depends on: evaluating a shipment’s priority against what it actually feeds, not against a generic lateness threshold.
A global FMCG manufacturer running distribution across 10 Asian countries and more than 1,000 distributors reached a 3X return on investment while optimizing more than $4 billion in orders, evidence that constraint-based prioritization scales to manufacturing-adjacent distribution complexity rather than only to simpler point-to-point delivery networks.
Common Mistakes to Avoid With Line-Down Risk Prioritization
Treating every inbound shipment to a plant as equally urgent once it is late. A uniform lateness threshold ignores the fact that two equally late shipments can carry wildly different downstream costs depending on which line and station they feed.
Letting buffer depth data go stale. A line-down-risk score is only as good as its buffer assumption. A system working from last week’s buffer levels, rather than current consumption, will misprioritize exactly the shipments this approach is meant to protect.
Routing line-down-risk shipments through the same exception process as routine delays. A shipment approaching genuine line-down risk needs a faster, more aggressive response than a routine late delivery, and funneling both through identical manual escalation erases that distinction.
Assuming downtime cost is uniform across every line and station. A final-assembly line with no downstream buffer and a sub-assembly line with hours of slack do not carry the same downtime cost, and a single plant-wide downtime figure applied everywhere will misprioritize between them.
How Locus Approaches Line-Down Risk in Manufacturing Inbound Logistics
Locus, the world’s first Decision-Intelligent, Agentic TMS, evaluates inbound shipments against the specific production schedule and line dependency they feed inside the same route planning system that handles cost, time windows and vehicle capacity. Because Locus’s engine already models more than 250 real-world constraints per computation, buffer depth and downtime cost can be added as live inputs that reprioritize a shipment continuously, rather than as a one-time configuration checked once at dispatch. Locus has been recognized by Gartner for seven consecutive years, featured in the 2026 Hype Cycle for Supply Chain Execution and Logistics Technologies, named a Leader in TMS by QKS Group’s SPARK Matrix, and ranked #1 in Route Planning on G2’s 2026 Best Software Awards.
A Fortune 50 parcel enterprise running more than 4,500 drivers uncovered more than $14 million in annualized operational opportunity through constraint-based prioritization, and a global FMCG manufacturer running distribution across 10 Asian countries reached a 3X return on investment, both evidence that evaluating priority against what a shipment actually feeds, rather than a generic lateness threshold, scales to real manufacturing-adjacent complexity.
In October 2025, Ingka Investments, the investment arm of Ingka Group, the world’s largest IKEA retailer, acquired Locus. Locus continues to operate independently.
A late delivery to a manufacturing plant is not the same problem as a late delivery to a customer, and prioritizing both the same way means treating a potential five-figure-per-hour production stoppage with the same urgency logic as a missed delivery window. Locus builds line-down risk into inbound prioritization as its own input, evaluated against the specific line and buffer a shipment feeds rather than against a generic lateness clock. If your inbound logistics software still prioritizes every late shipment the same way, schedule a demo to see how Locus tells the difference between late and about to stop a line.
Frequently Asked Questions
What is production line-down risk in inbound logistics? It is the risk that a late inbound shipment, typically a raw material or component, causes a production line to stop because the receiving plant’s buffer stock for that item runs out before the shipment arrives. It is distinct from ordinary delivery lateness because the cost of a line stoppage can be orders of magnitude higher than a standard missed delivery window.
How expensive is unplanned production downtime? Industry benchmarking widely cites automotive manufacturing downtime at roughly $22,000 a minute, with some specific stoppages running meaningfully higher. Across the broader US manufacturing sector, unplanned downtime is estimated to cost around $50 billion a year, and the cost per hour has risen roughly 50 percent since 2019.
Why can’t a standard TMS just use a tighter lateness threshold for manufacturing inbound logistics? Because lateness alone does not capture what makes a shipment risky. Two shipments can be equally late while carrying completely different downstream costs depending on which production line and station they feed and how much buffer stock that line has remaining.
What data does a TMS need to model line-down risk correctly? At minimum, which specific production line and station a shipment feeds, the current buffer depth for that component, and the downtime cost associated with stopping that specific line, updated continuously rather than set once.
Does this approach apply only to automotive manufacturing? No. Automotive is the most-cited example because its downtime costs are exceptionally well documented and its lines are highly interdependent, but any manufacturing operation running on tight buffer stock for critical components faces the same underlying prioritization problem.
What happens if buffer and downtime cost data is inaccurate? The risk score becomes unreliable in the same way a lateness-only model is unreliable, just in a different direction. Stale buffer data can cause the system to underweight a shipment that is actually close to causing a stoppage, or overweight one that is not.


Transportation Management System
10 Best Parcel TMS Solutions in 2026

Oct 1, 2026
Compare the top parcel TMS solutions for 2026 and see which platforms deliver the best routing, tracking, automation, and multi-carrier performance for high-volume shippers.
Read more
General
TMS for Just-in-Sequence (JIS) Delivery: Why Arriving on Time Is Not Enough in 2026

Oct 1, 2026
JIS delivery is not just-in-time with a tighter window, it is a different problem: parts have to arrive in the exact build order, with no on-site buffer to fix a sequencing error.
Read moreInsights Worth Your Time


















TMS for Production Line-Down Risk: Why a Late Delivery Means Something Different in Manufacturing in 2026