


General
Returns Management and Refund Cycle Time in 2026: Where the Days Actually Go

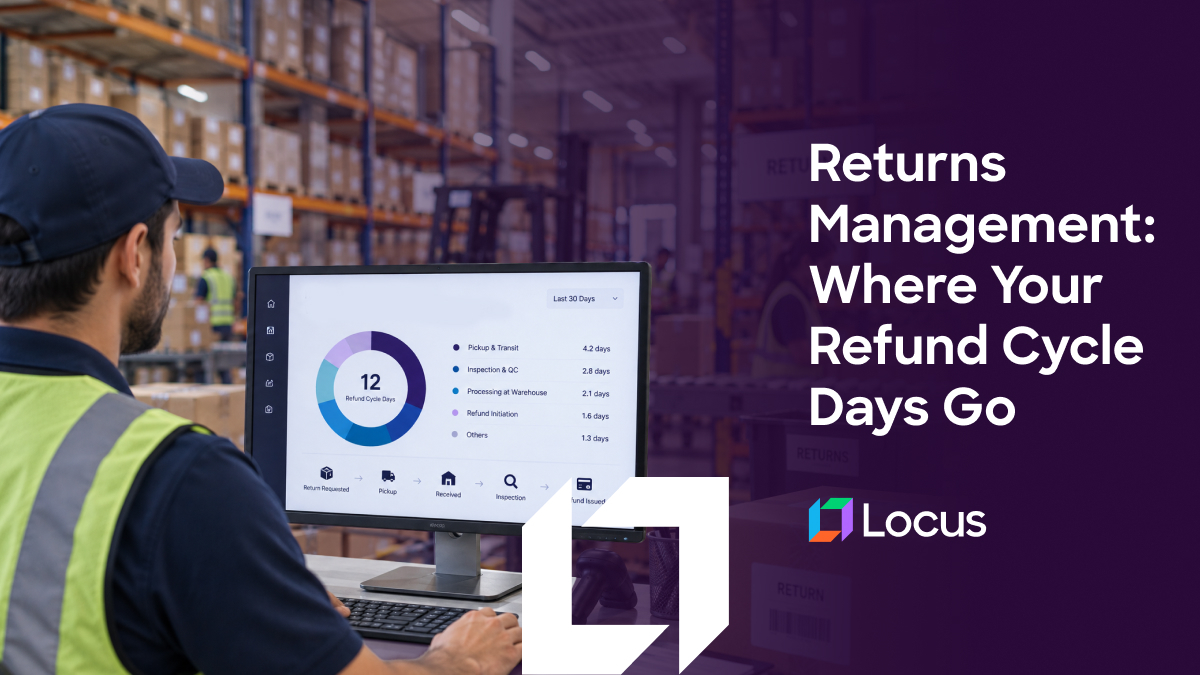
Refund cycle time is the elapsed time from a customer initiating a return to the refund reaching them, and it is the number a returns management program is judged on by customers, by finance and increasingly by the purchase decision itself. Most improvement effort goes to the warehouse legs, inspection and disposition, because those are the parts the retailer directly controls and the parts a returns platform reports on. The transport legs, collection and transit to the receiving site, are usually treated as fixed. They are not fixed, they are the largest contributor, and more importantly they carry most of the variance, which is what actually sets the number a retailer can promise. Locus, the world’s first Decision-Intelligent, Agentic TMS, operates on those legs, planning collection and transit against more than 250 real-world operating constraints rather than accepting them as given.
Key Takeaways
- In this model the transport legs account for 60% of mean refund cycle days and 76% of the total variance.
- A refund promise has to be set on a quantile rather than a mean, so variance drives the advertised number more than average speed does.
- Cutting transport variance by three quarters moves a 95% refund promise from 11.0 days to 9.5, without changing the mean at all.
- The slowest single leg is booked-to-collected at 2.1 days, and it is also the largest single source of variance at 47%.
- Taking 1.5 days out of the cycle releases roughly $1.3M of merchandise value at $2B of sales and $7.8M at $12B.
- Locus plans collection and transit inside the same decision layer as forward delivery, which is where the variance in those two legs is produced.
Why Refund Cycle Time Matters: The Business Case
Returns now influence the sale rather than following it. The National Retail Federation’s 2025 Retail Returns Landscape, produced with Happy Returns, found 82% of consumers cite free returns as a major consideration when purchasing, up from 76% the previous year, against returns running at 15.8% of annual sales and 19.3% of online sales. A refund promise is therefore a marketing asset, and its length is set by operations.
There is also a working capital dimension. Every day between collection and refund is a day of merchandise value sitting in transit or in a receiving queue rather than back in sellable inventory, at a volume the same research puts at $849.9 billion across US retail in 2025.
The transport legs that carry most of that time are also the ones where cost has been rising. ATRI’s 2026 analysis puts the industry-average operating cost at $2.336 per mile in 2025, the highest in the report’s history, which is why the usual response to slow collection, simply adding vehicles, is unattractive.
Speed in the reverse leg is bought the same way it is bought in the forward leg, through density. McKinsey finds that raising drops per stop from one to five cuts labor and vehicle cost by more than 50%, and the same density that makes a collection cheap is what makes it prompt, because a dense zone is served more often. Where a retailer’s own network cannot supply that density, the Pitney Bowes Parcel Shipping Index records non-major carriers doubling their share of US parcel revenue from 3.4% to 7.2% in a 23.1 billion parcel market, which is where much of the thin-zone collection capacity now sits.
The alternative is consolidation, and its economics are published. Locus data puts standalone return pickups at $4 to $6 per item against under $1.50 consolidated, which matters here because consolidation and speed pull in opposite directions unless they are planned together.
Where the Days Go
The decomposition below splits refund cycle time into five legs, each with a mean and a standard deviation. Values are illustrative; substitute your own and the structure holds.
1 The cycle is five legs, and only two of them are usually measured
| Leg | Mean days | Standard deviation | Share of mean | Share of variance |
|---|---|---|---|---|
| Customer initiates to pickup booked | 0.6 | 0.3 | 9% | 1% |
| Booked to pickup executed | 2.1 | 1.8 | 31% | 47% |
| Pickup to receipt at hub | 1.9 | 1.4 | 28% | 29% |
| Receipt to inspection complete | 1.3 | 1.1 | 19% | 18% |
| Inspection to refund issued | 0.8 | 0.6 | 12% | 5% |
| Total | 6.7 | 2.6 |
Most returns platforms report the last two lines well, because those happen inside systems the retailer runs. The two transport legs in the middle are usually reported as a single carrier transit time, or not at all.
2 Transport is 60% of the days and 76% of the variance
Adding the two transport legs gives 4.0 of the 6.7 mean days. That alone is worth knowing. The more useful figure is the variance share: those same two legs contribute 76% of the total variation in how long a refund takes.
The distinction matters because mean and variance are improved by different things and cost different amounts. Shaving mean days off inspection is a throughput problem solved with people or automation. Reducing variance in collection is a planning problem, and it is the one that moves the promise.
3 A refund promise is set on a quantile, not on an average
No retailer advertises its mean refund time, because half of all customers would experience something worse. The advertised number has to cover the large majority of cases, which means it is set by the tail.
| Refund promise covers | Days needed today | With transport variance cut 75% |
|---|---|---|
| 90% of returns | 10.1 days | 8.9 days |
| 95% of returns | 11.0 days | 9.5 days |
| 99% of returns | 12.8 days | 10.7 days |
Cutting transport variance by three quarters takes 1.5 days off a 95% promise while leaving the mean untouched. An operation that had spent the same effort taking half a day out of the inspection mean would have improved the advertised number by considerably less, because inspection contributes 18% of the variance against transport’s 76%.
| Also Read: US Returns Hit $850 Billion in 2025: Why US Retailers Are Restructuring Reverse Logistics in 2026 |
|---|
4 The worst leg is the one between booking and collection
Booked-to-collected is 2.1 days on average and carries 47% of all variance, the largest single contribution in the cycle. It is also the leg that is least instrumented, because it sits between a returns platform that considers its job done once a booking exists and a carrier whose reporting begins at collection.
The variance in that leg comes from three sources: the gap between the window the customer was offered and the day the network can economically serve that zone, failed first attempts where nobody is available, and re-bookings after either. None of the three is visible in a standard returns report.
5 Speed and consolidation conflict unless they are planned together
The obvious way to cut the booked-to-collected leg is to collect sooner, and the obvious way to cut cost is to wait until enough collections accumulate in a zone to justify a route. Those are the same decision pulling in opposite directions, and most operations resolve it by policy: either a fixed collection SLA that forces uneconomic trips, or a consolidation rule that lets some customers wait a long time.
Neither is necessary if the collection is planned against the forward network rather than on its own. A return collected on a vehicle that was already going to that street costs the consolidated rate and does not wait for other returns to accumulate, because the density it needs comes from deliveries rather than from other collections. That is the only resolution of the conflict that does not require choosing.
6 The days are also merchandise sitting still
Every day in the cycle is a day of goods neither with the customer nor available to sell. At NRF’s 15.8% return rate, the pipeline is a standing balance rather than a transient one.
| Annual sales | Returns per year | Returns per day | Value in pipeline at 6.7 days | At 5.2 days | Released |
|---|---|---|---|---|---|
| $500M | $79M | $216k | $1.5M | $1.1M | $0.3M |
| $2B | $316M | $866k | $5.8M | $4.5M | $1.3M |
| $5B | $790M | $2.2M | $14.5M | $11.3M | $3.2M |
| $12B | $1.9B | $5.2M | $34.8M | $27.0M | $7.8M |
Taking 1.5 days out of the cycle releases roughly $1.3M of merchandise value at $2B of sales and $7.8M at $12B. That is a one-off release rather than an annual saving, and it is usually the argument that gets a returns transport project funded, because it is denominated in the same units the finance team already manages.
It also reframes which leg to attack. The release is proportional to days removed regardless of which leg they come from, but the promise improvement is proportional to variance removed, and those point at different work. A program aiming at working capital and a program aiming at a shorter advertised promise should not automatically do the same thing.
Variance is also what customers experience as unreliability rather than as policy. A refund that takes seven days every time is experienced as a policy. A refund that takes four days or twelve depending on nothing the customer can see is experienced as unreliability, and it generates the contacts, the escalations and the reduced likelihood of buying again.
This is why reporting a mean refund cycle time is close to useless as an operating measure. Two operations with identical means can produce completely different customer experiences and completely different contact volumes, and the reports will not distinguish them.
The contact volume is the part that shows up in someone else’s budget. A customer whose refund is inside the promised window rarely asks about it, and a customer outside it almost always does, so support contacts track the tail of the distribution rather than its middle. An operation that halves its variance without touching its mean will see contacts fall and will struggle to explain why, because the metric it reports did not move.
7 What to measure before changing anything
The decomposition above is buildable from data most retailers already hold, and almost none have assembled. Take a quarter of completed returns and record five timestamps: request, booking confirmed, collection completed, receipt scanned, refund issued. Compute the mean and standard deviation of each interval, then the variance share of each leg.
Two numbers come out of it. The first is where the days are, which usually surprises people less than they expect. The second is where the variance is, which usually surprises them a great deal, and it is the one that tells you which leg to work on if the goal is a shorter promise rather than a faster average. Run it once and the argument about where to invest resolves itself, because the two candidate answers stop being matters of opinion.
There is a third output worth capturing while the data is assembled: the share of returns where the collection required more than one attempt. That population sits inside the booked-to-collected leg and is usually the single largest contributor to its tail, but it is rarely separated out, so it gets absorbed into an average that makes the leg look moderately slow rather than mostly fine with an expensive minority. Splitting first-attempt collections from re-attempted ones typically shows two distributions with very little overlap, and only one of them needs fixing.
Mean-Led vs Variance-Led Returns Improvement: Key Differences
| Dimension | Managing the mean | Managing the variance |
|---|---|---|
| Metric reported | Average refund cycle time | Distribution by leg |
| Typical target | Inspection and disposition throughput | Collection and transit planning |
| Effect on the advertised promise | Small | Direct |
| Customer experience of improvement | Marginally faster | Noticeably more predictable |
| Investment shape | People and warehouse automation | Planning and routing |
| Where it shows up | Operations dashboard | Contact volume and repeat purchase |
What to Look for in Returns Management Software
Leg-level cycle time reporting, with variance. A single average refund time is not an operating measure. The platform should report each interval separately, with its distribution, or the improvement effort has nothing to aim at.
Instrumentation of booked-to-collected. This is the largest and least visible leg. Confirm the platform captures booking confirmation and collection completion as distinct timestamps, including failed attempts and re-bookings.
Collection planned against the forward network. Ask how a collection is placed on a vehicle already serving that street, because that is the only mechanism that improves speed and cost at the same time.
Promise setting from the distribution. The system should be able to tell the business what refund promise it can keep at a stated confidence, rather than leaving marketing to pick a number and operations to miss it.
Exception visibility during the collection leg. A failed attempt should raise an exception with a re-booking path, not sit silently until someone notices the return never arrived.
Cycle Time in Action: Real-World Results
A Canadian grocery brand delivering fresh and perishable orders across more than 30 cities ran its last mile through contracted third-party fleets. In the carrier orchestration deployment, moving allocation and tracking into one orchestration layer produced 33% faster deliveries, 15% lower fulfillment cost, 25% less manual shipping time, and customer support resolution 10 to 20 times faster. The support figure is the variance result in customer-facing form: contacts fall when the answer is already known, which is what happens when the transport legs are instrumented.
A leading North American retailer with several hundred stores consolidated six legacy systems in a multimodal automation program, resolving exceptions in under two hours against on-time store delivery above 99%, with route compliance above 95% and more than $1M returned in year one. Sub-two-hour exception resolution is a variance number rather than a mean one, and it is the capability that shortens a promise rather than the average.
Common Refund Cycle Time Mistakes to Avoid
Reporting a single average refund time. It hides which leg is responsible and it does not predict what promise the operation can keep. Report by leg, with variance.
Improving inspection throughput to shorten the promise. Inspection carries 18% of variance against transport’s 76%, so effort there moves the average a little and the advertised number barely at all.
Leaving booked-to-collected uninstrumented. It is the single largest source of variance in the cycle and it usually falls between the returns platform and the carrier, with neither reporting it.
Resolving the speed-versus-cost conflict by policy. A fixed collection SLA forces uneconomic trips and a consolidation rule makes some customers wait. Planning collections against the forward network avoids the choice.
How Locus Shortens the Refund Clock
Locus, the world’s first Decision-Intelligent, Agentic TMS, works on the two legs that carry most of the variance. The route planning system places a collection on a vehicle already serving that street rather than waiting for other returns to accumulate, which is what allows the booked-to-collected leg to shorten without the cost of a dedicated trip. Because the Dispatch and Customer agents instrument booking, attempt and completion as distinct events, a failed first attempt raises an exception with a re-booking path instead of disappearing into the gap between a returns platform and a carrier, and the operation can state the refund promise it is able to keep at a given confidence rather than discovering the answer from complaints.
Locus is recognized by Gartner for seven consecutive years, featured in the 2026 Hype Cycle for Supply Chain Execution and Logistics Technologies, named a Leader in TMS by QKS Group in the SPARK Matrix, and ranked #1 in Route Planning on G2’s 2026 Best Software Awards. In October 2025, Ingka Investments, the investment arm of Ingka Group, the world’s largest IKEA retailer, acquired Locus. Locus continues to operate independently.
Refund cycle time is decided mostly in transport and almost entirely in variance. The two transport legs carry 60% of the mean days and 76% of the variation, with booked-to-collected alone contributing 47%, and because a refund promise has to be set on a quantile rather than an average, that variation is what determines the number a retailer can advertise. Cutting transport variance by three quarters takes a 95% promise from 11.0 days to 9.5 without touching the mean, which is more than warehouse throughput improvement can deliver for the same effort. The mechanism is planning collections against the forward network so that speed and consolidation stop competing. Locus does that in one decision layer across both directions. Request a Locus refund cycle assessment to see where your own days and variance sit.
Frequently Asked Questions
What is refund cycle time in returns management?
Refund cycle time is the elapsed time from a customer initiating a return to the refund reaching them, spanning booking, collection, transit, receipt, inspection and payment. It is the number customers judge a returns program by, and increasingly a factor in the original purchase decision.
Which part of the returns process takes longest?
In this model the two transport legs dominate: booked-to-collected at 2.1 days and collection-to-receipt at 1.9 days, together 60% of a 6.7-day mean. The warehouse legs, inspection and refund issuance, account for 31% between them despite receiving most of the improvement attention.
Why does variance matter more than average refund time?
Because a refund promise has to cover the large majority of cases, not the average one. In this model the mean is 6.7 days but a promise covering 95% of returns needs 11.0 days, and that gap is set by variance. Reducing variation shortens the advertised promise even when the average does not move.
How much can transport improvement shorten a refund promise?
Cutting transport variance by three quarters moves a 95% promise from 11.0 days to 9.5 in this model, a gain of 1.5 days with no change to the mean. Equivalent effort spent on inspection would move it far less, because inspection carries 18% of variance against transport’s 76%.
Why is the booked-to-collected leg so variable?
Three reasons: the gap between the collection window offered to the customer and the day the network can economically serve that zone, failed first attempts where nobody is available, and re-bookings after either. The leg also falls between a returns platform that stops at booking and a carrier whose reporting starts at collection, so it is frequently uninstrumented.
Do faster collections have to cost more?
Only when collections are planned on their own. Waiting for enough returns to accumulate in a zone is what makes consolidation cheap and makes customers wait. Placing a collection on a vehicle already delivering in that street takes its density from the forward network instead, which removes the trade-off rather than balancing it.


General
Returns Management in 2026: Why You Cannot Consolidate a Pickup You Do Not Know About Yet

Sep 16, 2026
Consolidating return pickups cuts cost by roughly 70%, but only for returns the planner knows about before it commits the route. At an 18-hour commit, 45% are invisible.
Read more
General
Why Returns Management is a TMS Problem, Not Just a Warehouse Problem
Sep 16, 2026
Transportation owns 49% of returns cost and every decision about when goods arrive. Collecting every three days instead of daily doubles the warehouse a retailer has to build.
Read moreInsights Worth Your Time



















Returns Management and Refund Cycle Time in 2026: Where the Days Actually Go