


General
Order-to-Delivery Automation Map: Which Stages Software Automates and Which Still Go to People in 2026

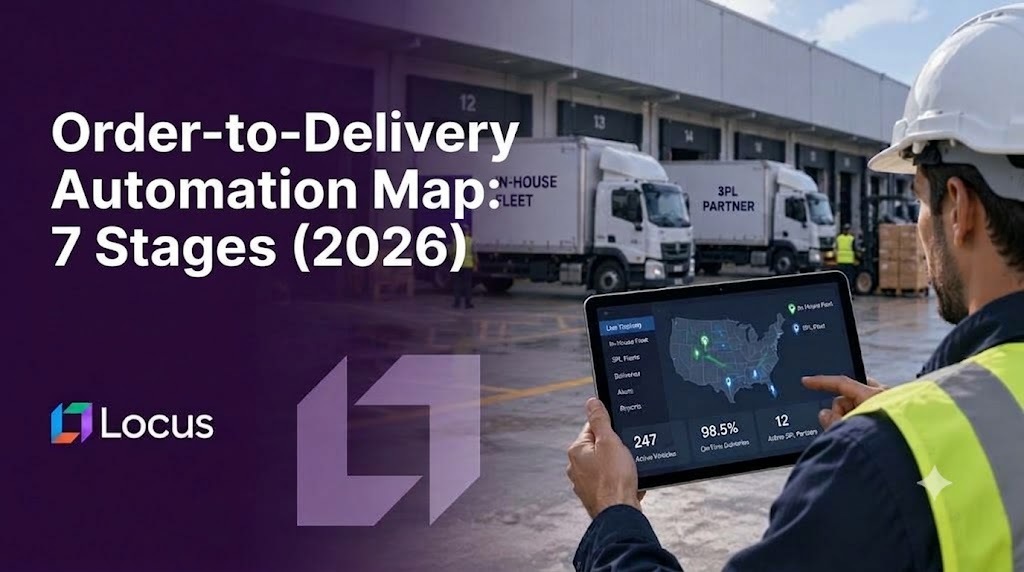
An order-to-delivery automation map is a stage-by-stage view of the path from order capture to freight settlement that shows, for each stage, which work software already does, which decisions still go to people and how to measure the difference. End-to-end delivery execution is rarely automated end to end: picking and packing may run on rules while node selection, carrier choice, re-planning, proof-of-delivery review and invoice audit stay manual, and the manual steps set the delivery speed. The map below has seven stages, an independent data point for each where one exists, and a published-versus-not-published view of Locus, so a Director of Operations can see where a platform’s automation claim stops.
Key Takeaways
- Seven stages run from order capture to settlement: capture and promise, allocation, planning, carrier sourcing, execution with exceptions and communication, proof of delivery, and settlement.
- The APQC median order cycle time is 12.0 days, perfect order performance is 88.0% and 88.0% of sales orders are filled from the primary sourcing location, so the stages before the truck rolls matter.
- In an illustrative order-log model, 18.7% of orders get a human touch, with node review (7.1%), carrier review (6.0%), exceptions (5.0%) and manual re-sourcing (2.1%) as the sources.
- Workflow automation runs a fixed sequence, while decision automation chooses among alternatives on live data, and most gaps sit in decision stages.
- The stage-level independent data is thin, with no independent source found for proof-of-delivery disputes or dispatcher re-planning time.
- Locus publishes agents for stages two to seven, but not inventory availability or pick-pack logic, customs filing, accessorial handling or how its AI validates proof of delivery.
Why the Stage View Matters: The Business Case
An automation percentage hides where the work still sits, and the published benchmarks show the stages that decide delivery performance.
- APQC reports a median customer order cycle time of 12.0 days from order placed to delivered across 12,074 companies, so the path has many stages in which delay can build.
- APQC’s median perfect order performance is 88.0%, and its median for sales orders filled from the primary sourcing location is 88.0%, so roughly one order in eight misses on delivery quality and a similar share needs a second source.
- A peer-reviewed study in Production and Operations Management found that up to 20% of business-to-consumer deliveries can fail on the first attempt, and that a sequencing algorithm cut failed attempts by 10% and cost by $13 per route in a field experiment.
- APQC’s median premium freight charges are 8.0% of freight charges, which is the cost of late decisions upstream.
- Gartner’s September 2026 release predicts that by 2030 only 5% of organizations implementing planning automation will make at least 10% of planning decisions autonomously, a statement about planning and about organizations already automating, not about all execution.
Workflow Automation vs Decision Automation by Stage: Key Differences
The distinction that matters at each stage is whether software runs a fixed sequence or chooses among alternatives on live data against an objective. Both are useful, and they fail differently.
| Stage | Typically automated as workflow | Still decided by people or ad hoc | Software category |
|---|---|---|---|
| 1. Order capture and promise | Order intake, validation, address checks | Which delivery window to promise, which orders to refuse | OMS, checkout promising |
| 2. Allocation and node | Rule-based routing to a default node | Overrides, split shipments, re-sourcing after a pick failure | OMS, distributed order management |
| 3. Planning and consolidation | Batch route generation | Re-planning when constraints change, balancing cost and service | Route planning, dispatch platform |
| 4. Carrier sourcing and tender | Rate lookup, fixed routing guides | Carrier choice per load, fallback when a carrier declines | TMS, carrier orchestration |
| 5. Execution, exceptions and communication | Status capture, ETA display, template messages on status events | Reassignment, recovery of at-risk stops, triage, who gets a human and what to offer | Dispatch, visibility, driver app, delivery experience, control tower |
| 6. Proof of delivery | Photo, signature and scan capture | Review of disputed or incomplete proofs | Driver app, ePOD review |
| 7. Settlement | Invoice matching on exact references | Overcharge disputes, accessorials, payment release | Freight audit, settlement |
How the Seven Stages Work and Where Humans Still Sit
Each stage below states what software does, what remains with people and the measure to track.
1. Order capture and promise
Software validates orders and addresses and can check capacity before promising a window. People decide which promises to refuse at peak. Measure the share of orders promised a window the network can keep.
2. Allocation and node
Rules route an order to a default node, and exceptions go to a person. APQC’s median of 88.0% of orders filled from the primary location means the rest need a second source. Measure manual overrides and time to re-source after a pick failure.
3. Planning and consolidation
Planning engines generate routes, but re-planning when a driver, vehicle or order changes is often manual. Measure time from change to committed plan.
4. Carrier sourcing and tender
Rate lookup and tendering can be automated, while choosing a carrier for each load and handling a decline needs live data. Measure acceptance by tier and the share of loads that fall to spot.
5. Execution, exceptions and communication
Status capture is largely automatic and template messages fire on events. Reassigning an at-risk stop and deciding which customer gets a human are decisions, and the sequencing study above found that its algorithm cut failed first attempts by 10% and that stops later in a route fail less often. Measure re-plan time, failed first attempts, contacts per exception and time to first response.
6. Proof of delivery
Capture is automated through photo, signature and scan. Review of incomplete proofs is where manual effort sits. ATRI found drivers detained at 39.3% of stops in 2023, and documentation gaps are one reason accessorials go uncollected. We found no independent data on proof-of-delivery disputes. Measure the share of proofs reviewed by a person.
7. Settlement
Matching invoices on exact references is automatable. Disputes, accessorials and payment release need rules and judgment. APQC’s median for invoices processed error free the first time is 92.0%, a general accounts payable measure and not a freight figure. Measure the share of invoices paid without human review.
What to Look for in End-to-End Delivery Execution Software
Stage coverage stated stage by stage
The vendor should say which of the seven stages its platform automates, which it integrates with and which it leaves to your OMS, WMS or finance system.
Decisions, not only workflows
Ask which stages choose among alternatives on live data and what objective and constraints they use, since a fixed sequence breaks when conditions change.
Autonomy you can set by stage
Look for approval levels per decision type, with a log of what the system decided and why, so autonomy can rise stage by stage.
Stage-level measurement
The platform should report touch rate, decision latency and override rate by stage, so you can see where people still sit.
Honest limits
The vendor should state what it does not do, such as pick and pack logic, customs filing or specific audit rules.
Order-to-Delivery Automation in Action: Real-World Results
Where the touches sit in an illustrative order-log model. The inputs are assumptions and not a benchmark. In a model of 10,000 orders a week, 7% of orders are held for manual node review, 6% get a manual carrier review, 3% suffer a pick failure of which 70% are re-sourced by a planner, and 5% have an exception needing one to three touches.
| Stage | Orders touched by a person | Source of the touch |
|---|---|---|
| Allocation and node | 7.1% | Manual node review |
| Carrier sourcing | 6.0% | Manual carrier review |
| Exceptions | 5.0% | Address, hold or carrier problems |
| Re-sourcing after pick failure | 2.1% | Planner re-allocation |
| Any stage | 18.7% | At least one touch |
The touchless rate in that model was 81.3%, yet the median wait between capture and dispatch commit was 4.7 hours because release waves and cut-offs set the clock. A touch rate and a delay measure are separate numbers, which is why the map asks for both at each stage.
A Fortune 50 parcel and logistics leader. The enterprise dispatches 4,500+ captive and third-party drivers against one live view of its network, with every autonomous decision logged for explainability and human override. Weekly execution rose from 75% to 92% across 51 sites. The case spans planning, dispatch and execution, and it does not publish stage-level touch rates. Read the Fortune 50 case study.
A global food and beverage leader. In Thailand alone the company moves more than 18 million orders a year with over 5,000 vehicles dispatched monthly, and Locus’s agents cover dispatch, carrier, settlement, capacity, hub and customer decisions. The company reported 97%+ SLA adherence and about 90% of manual proof-of-delivery reviews automated. Read the global FMCG case study.
Common Order-to-Delivery Automation Mistakes to Avoid
Counting automated steps instead of measuring touches. A step is automated only if no person changes its result.
Automating capture and tracking while leaving decisions manual. Status screens improve visibility but not the stages that set delay.
Ignoring the back end. Proof-of-delivery review and invoice audit are where cost leaks after delivery, so include them in the map.
Setting one autonomy level for every stage. Reversible stages can move faster than costly ones, so set autonomy stage by stage.
| Also Read: Which Dispatch Decisions Should Your AI Make? A Decision-by-Decision Autonomy Map for 2026 |
|---|
How Locus Maps to the Seven Stages, and What to Confirm
Locus, the world’s first Decision-Intelligent, Agentic TMS, describes an order flow of seven phases in which algorithms and agents make the decisions and humans govern. Its Capacity Agent matches incoming demand to the right fleet and commits a promise, its Dispatch Agent builds routes against live constraints and replans when a constraint shifts, its Carrier Agent scores lanes and auto-tenders within policy, its Hub, Dispatch and Customer agents run execution, exceptions and communication, and its Settlement Agent performs four-way matching and flags overcharges, with an Orchestrator and a Copilot above them. The Driver Companion App captures proof of delivery with item-level scanning and signature, Delivery Promise Management checks every leg before a window is sold, and every decision is logged under six governance mechanisms with autonomy levels set per agent and domain. Locus has optimized 1.5B+ deliveries for 360+ enterprise customers across 30+ countries.
Recognized by analysts and selected after evaluation. Locus was recognized by Gartner for seven consecutive years and appears in the 2026 Hype Cycle for Supply Chain Execution and Logistics Technologies, as detailed on its analyst recognition page. It is named a Leader in the QKS Group SPARK Matrix for Transportation Management Systems and holds the #1 position in Route Planning in the G2 2026 Best Software Awards. In October 2025, Ingka Investments, the investment arm of Ingka Group, the world’s largest IKEA retailer, acquired Locus. Ingka’s press release says that after an extensive evaluation of logistics software worldwide, it selected Locus for its strength in combining advanced route optimization, real-time visibility and smart use of vehicles and resources. Locus continues to operate independently.
What this means for the map. Locus covers stages two to seven with named agents and runs beside the OMS, WMS and ERP, which stay the systems of record, and it integrates with them and has public API documentation.
What to confirm. Locus’s public pages do not describe inventory availability or node-selection rules, split-shipment logic, pick failure handling, pick and pack logic, customs filing, accessorial or detention handling, how its AI validates proof of delivery, how the remaining manual reviews are routed, or per-agent autonomy thresholds. The seven phases are shown as hover cards on its TMS page and the customer results are self-reported.
To see where people still sit in your own order flow, schedule a demo.
For operations leaders asking which software automates delivery execution end to end, Locus offers governed decisioning from promise to settlement beside your existing systems, so each stage can be measured for touch rate and decision delay.
Frequently Asked Questions
What is an order-to-delivery automation map? A stage-by-stage view from order capture to settlement that shows what software automates, what people still decide and how to measure each stage. It separates workflow automation, which runs a fixed sequence, from decision automation, which chooses among alternatives on live data.
Which stages of delivery execution are least automated? In the illustrative model, node review, carrier review, exceptions and manual re-sourcing were the main sources of touches, and proof-of-delivery review and invoice audit are common manual back-end stages. We found no independent data on how much of each stage is automated.
What is the best software to automate end-to-end delivery execution? It depends on the stages you need. An OMS or WMS covers capture, allocation and picking, while a decisioning platform covers planning, carrier sourcing, dispatch, exceptions, proof of delivery and settlement. Locus publishes agents for stages two to seven and runs beside your OMS and WMS.
How do you measure how automated an order flow really is? Measure the share of orders with no human touch by stage and the delay between stages, since a high touch-free rate can sit beside long waits caused by batches and cut-offs.
What does the APQC order cycle time tell me? APQC’s median customer order cycle time is 12.0 days from order placed to delivered across 12,074 companies, a baseline for your own cycle. It is a cross-industry figure and not a delivery-execution benchmark.
Does Locus automate every stage? No. Locus publishes agents for stages two to seven and does not describe inventory availability, pick and pack, customs filing or accessorial handling on its public pages. Ask for details on any stage that matters to you.


General
Best Direct Store Delivery Software for Enterprise Beverage and FMCG Buyers in 2026: A Vendor Comparison

Oct 27, 2026
Eight DSD vendors compared by layer for enterprise beverage and FMCG buyers, with published capabilities, questions to ask and why Locus fits the routing and dispatch layer.
Read more
General
What Public Documentation Actually Shows: A Published-Capability Audit of Eleven Logistics Orchestration Platforms in October 2026
Oct 27, 2026
We scored 11 logistics orchestration platforms on ten criteria using only what their own public pages state in October 2026, with a matrix, method limits and a candid view of Locus.
Read moreInsights Worth Your Time

















Order-to-Delivery Automation Map: Which Stages Software Automates and Which Still Go to People in 2026