


General
Driver Management for Beverage Routes in 2026: Physical Load, Compliance and High-Frequency Stops

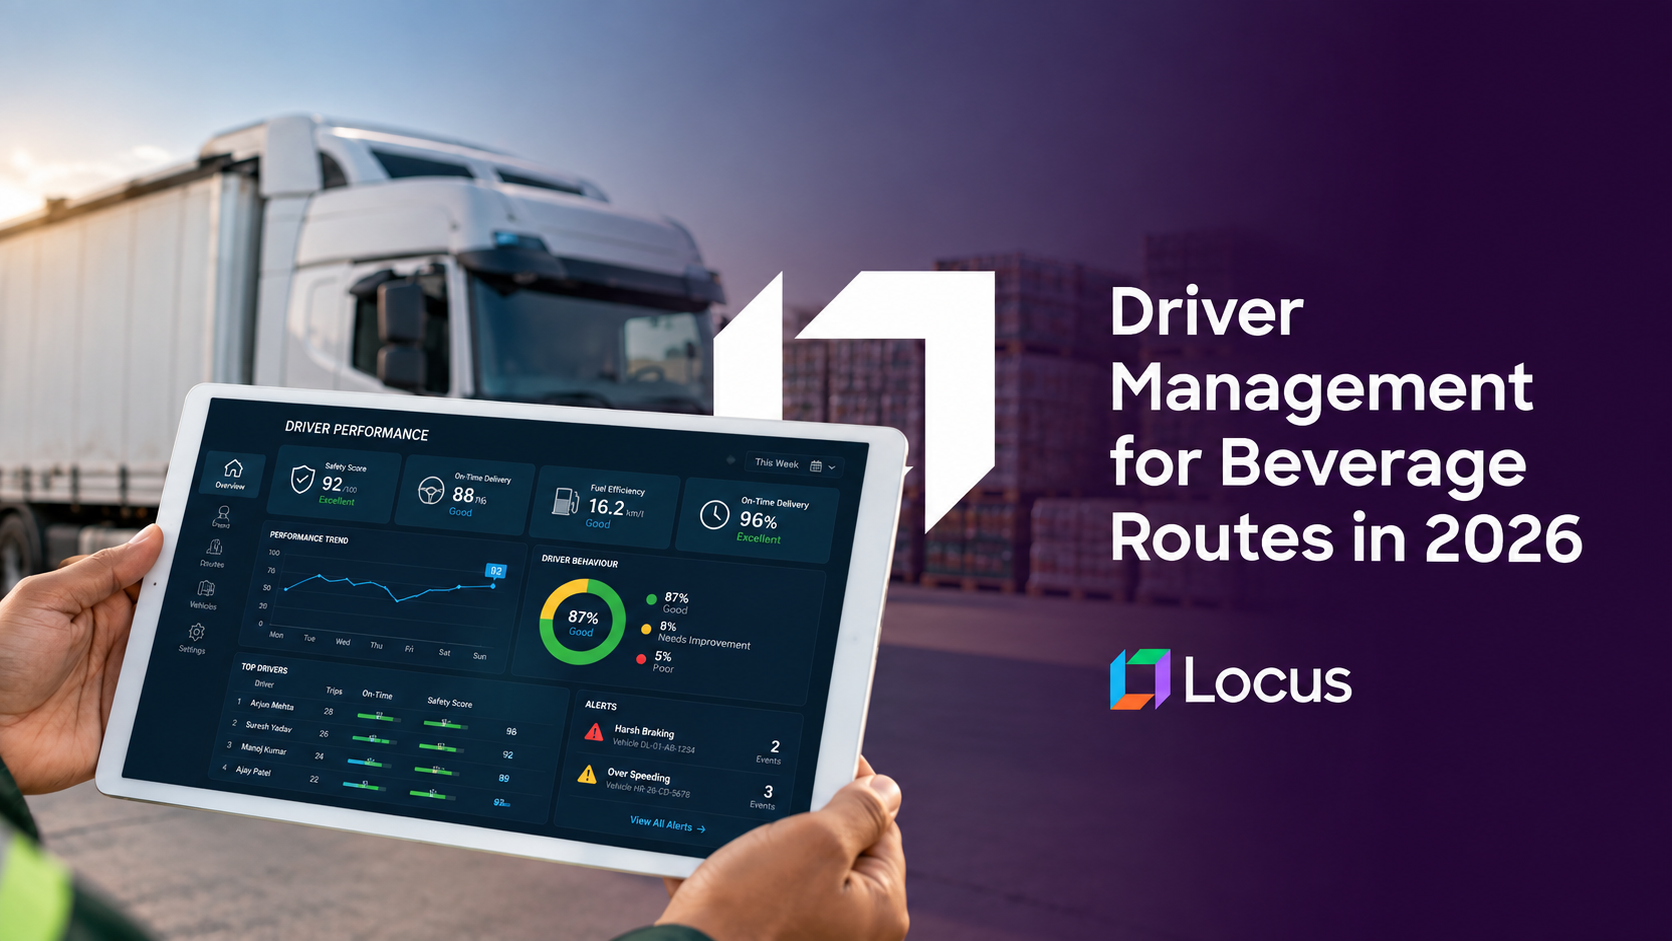
Driver management for beverage distribution is a different discipline from managing a parcel or long-haul driver, because the work itself is different. A beverage driver makes many more stops per shift than a typical last-mile driver, moves substantial physical weight at each one, performs merchandising that a parcel courier never touches, and in alcohol carries a compliance obligation whose failure is a legal matter rather than a service one. Most driver scorecards were designed around distance and on-time arrival, which measures the smaller part of that day. Locus, the world’s first Decision-Intelligent, Agentic TMS, holds driver qualifications, service history and compliance requirements inside the same constraint set that allocates the work.
Key Takeaways
- Beverage driver work is dominated by handling rather than driving, so a scorecard built on miles and on-time arrival measures the minority of the shift.
- In our illustrative model of eight comparable drivers, six changed rank by two or more places when scored on cases handled per paid hour instead of on miles per stop.
- The driver ranked best on distance placed sixth of eight on handling, which is the practical cost of scoring the wrong variable.
- In alcohol delivery the licensee remains responsible for what a delivery agent does, so an age check at the doorstep is a license risk rather than a policy preference.
- Locus holds qualifications and service history as constraints the allocation engine reads, and raised orders per delivery trip 22% at a large Vietnamese beverage distributor.
Why Beverage Driver Work Is Not Last-Mile Driver Work
The clearest way to see the difference is to look at where the shift goes. Our own analysis of beverage routing puts service time at roughly three quarters of the route clock, because a beverage stop involves moving cases, rotating stock, restocking coolers, building displays and completing paperwork. A parcel courier’s stop is a handover measured in a minute or two.
That has consequences for everything downstream. Physical load is a real occupational variable rather than a footnote, because a driver moving several hundred cases a day is doing manual work that accumulates across a week and a career. Stop frequency compounds it: more stops per shift than most last-mile roles means more lifting cycles, more vehicle entries and exits, and more customer interactions to manage.
The economics justify the attention. McKinsey’s out-of-home delivery work puts the last mile at 60% to 70% of total parcel delivery cost, and in a DSD operation the driver is the largest single component of that. A distributor that improves how it selects, trains, allocates and measures drivers is working on its biggest cost line, not on an HR program.
Conditions are also making the job harder in ways that show up as driver performance. INRIX’s 2025 Global Traffic Scorecard found congestion increased in 254 of the 290 US cities it analyzed, and the US Environmental Protection Agency’s climate indicators report heat wave frequency in major American cities rising from two per year in the 1960s to six per year in the 2010s and 2020s. More cases to move, in hotter weather, through slower traffic, is a workload change that no scorecard built on miles will register.
What Happens When You Score the Wrong Variable
We modeled eight drivers on comparable beverage routes and scored them two ways. The first scorecard uses miles per stop and on-time arrival, which is the conventional pairing. The second uses cases handled per paid hour and deliveries refused at the account. The inputs are illustrative rather than measured.
| Driver | Stops | Miles per stop | On-time | Cases per paid hour | Refused |
|---|---|---|---|---|---|
| F | 20 | 1.5 | 99% | 71.0 | 3 |
| C | 24 | 1.7 | 94% | 68.9 | 0 |
| E | 25 | 2.2 | 93% | 67.9 | 3 |
| H | 23 | 2.6 | 95% | 59.0 | 1 |
| A | 21 | 1.6 | 94% | 56.0 | 0 |
| B | 25 | 1.5 | 97% | 55.8 | 3 |
| G | 22 | 2.2 | 92% | 53.9 | 1 |
| D | 19 | 3.0 | 97% | 45.2 | 2 |
Ranked on miles per stop and on-time, the order runs B, F, A, C, G, E, H, D. Ranked on cases per paid hour and refusals, it runs F, C, E, H, A, B, G, D.
Six of the eight drivers move by two or more places between the two scorecards. Driver B, the best performer on the distance measure, places sixth of eight on handling. Driver E, sixth on distance, places third on handling.
Only Driver D is consistent, which is the useful detail: a scorecard measuring the wrong thing still catches the clearly weak performer, which is why the problem persists. The scorecard appears to work because its bottom is right, while its middle and top are close to noise.
Service time in this model ranged from 57% to 70% of the paid day across the eight drivers, and that variation is the thing a distance-based scorecard cannot see. Two drivers with identical mileage and identical on-time performance can differ by a quarter in how much product they move per hour paid, and nothing in the conventional report will say so.
The practical implication is uncomfortable. If coaching, route assignment, incentive payments and retention decisions are built on the first ranking, a distributor is systematically rewarding and promoting on a measure that reflects the geography of the route more than the performance of the person driving it.
Compliance Is Part of the Delivery, Not Around It
In alcohol distribution the driver performs a legal act at the doorstep, and the consequences of getting it wrong sit with the license rather than with the service level.
California’s Department of Alcoholic Beverage Control is explicit that where a licensee uses a third-party delivery service, that service acts as an agent of the licensee under the license’s privileges, and the department may pursue disciplinary action against the license for furnishing alcohol to a minor in the same way as if the sale had happened on the premises. Enforcement runs minor-decoy operations at the point of delivery, which means the check happens at the door and is tested there.
Requirements are also tightening in specific jurisdictions. Utah’s new 100% ID law took effect on 1 January 2026, requiring licensed establishments to check identification for every alcohol purchase regardless of how old the customer appears, removing the age-appearance discretion that previously applied. It is a state law rather than a national standard, which is precisely the point for a multi-state distributor: the obligation at the doorstep varies by where the doorstep is.
For driver management that produces three concrete requirements. The driver must be qualified to make the delivery in that jurisdiction, and the allocation engine has to know it before assigning the stop. The check has to be captured as evidence rather than asserted, because a disciplinary proceeding will ask for the record. And the rule set has to be per-jurisdiction rather than per-company, because a single national policy will be either too loose somewhere or needlessly restrictive everywhere else.
How to Manage Beverage Drivers Well
1 Score on handling throughput, not on distance
Use cases or units moved per paid hour as the primary productivity measure, with refusals and compliance failures alongside it. Distance measures the route’s geography more than the driver’s contribution.
2 Normalize the scorecard for route difficulty
A driver on dense urban accounts with cellar drops is not comparable to one on suburban forecourts. Compare within route type, or adjust for it, or the scorecard ranks territories rather than people.
3 Put qualifications in the allocation constraint set
Alcohol endorsements, license class, jurisdiction-specific certification and account-specific training should gate assignment automatically. A qualification that lives in an HR system the dispatcher cannot see is a compliance exposure waiting for a busy morning.
4 Onboard for the account, not only for the vehicle
Most beverage onboarding covers driving and safety and stops there. The part that determines a new driver’s first month is knowing how accounts receive, how displays are built and what each store expects, which is trainable and rarely trained.
5 Capture compliance evidence at the stop
Age verification, proof of delivery, photographs of shelf and cooler condition and returnable asset counts should all be captured by the driver app in the moment. Evidence reconstructed later is not evidence.
6 Manage physical load as a planning variable
Cases handled per shift is a workload measure as well as a productivity one. Where routes are consistently heavy, the planner should be balancing them rather than leaving the difference to whoever is assigned.
Onboarding Is Where the First Month Is Won
Most beverage driver onboarding covers the vehicle, the safety rules and the handheld, and then puts the new driver on a route. That sequence treats the job as driving with deliveries attached, which the shift breakdown above says it is not.
The part that determines a new driver’s first month is account knowledge, and it is learnable rather than innate. Which door receives at each account, who signs, where the cooler sits, how the display is built, which stores are impossible between eleven and two, and where the cellar hatch is on the pavement. An experienced driver holds hundreds of these facts and uses them at every stop. A new driver holds none, which is why new-driver service times run long in a way that looks like slowness and is actually ignorance of the specific.
The operational fix is to move that knowledge out of individual memory and into the account record, so a new driver arrives at a stop already knowing what the experienced driver knew. That also removes the hidden cost of route changes, because a system that holds account instructions centrally is one where reassigning a driver no longer resets the learning curve.
The second fix is to ramp deliberately. A new driver given a shorter route with familiar account types builds handling speed before being asked to carry a full one, and the scorecard should reflect that they are on a ramp rather than comparing them to a driver of five years. Where neither happens, early turnover gets attributed to the individual when it was set by the assignment.
Parcel Driver Management and Beverage Driver Management Compared
| Dimension | Parcel or last-mile driver | Beverage DSD driver |
|---|---|---|
| Dominant shift component | Driving between stops | Handling and merchandising at the stop |
| Stop duration | A minute or two | Substantially longer, and variable by account |
| Physical demand | Light to moderate | Sustained, hundreds of cases per shift |
| Right productivity measure | Stops per hour, miles per stop | Cases handled per paid hour |
| Compliance at the door | Signature or photo | Age verification where alcohol is carried, per jurisdiction |
| Consequence of a compliance failure | A service exception | Action against the license |
| Value of account familiarity | Low | High, it directly reduces service time |
| Onboarding focus | Vehicle, app, safety | Vehicle, safety, accounts and merchandising |
The familiarity row deserves attention because it conflicts with how most allocation engines behave. Rotating drivers looks efficient on a distance model, and on a route where handling is most of the clock it costs real minutes at every stop where the driver does not know the store.
What to Look for in Driver Management Software for Beverage
Qualification as an allocation constraint. The system should refuse to assign an alcohol delivery to an unqualified or uncertified driver rather than flagging it afterward. Ask to see what happens when an allocation would breach a jurisdiction rule.
Handling-based productivity measurement. Confirm the platform can report cases or units moved per paid hour by driver and by route type, because a platform that only reports distance and on-time cannot support the scorecard this article argues for.
Service time learned per driver and account. The pair matters more than either alone. A platform that tracks how long a given driver takes at a given account holds the data that makes familiarity a manageable variable.
Compliance capture in the driver app. Age verification, proof of delivery, condition photographs and asset counts should be captured in one flow at the stop. Anything captured on paper and entered later will be incomplete when it is needed.
Route difficulty normalization. Ask how the platform compares drivers working different territory types. Without it, a scorecard rewards the easy route and a good driver on hard accounts looks like a problem.
Beverage Driver Management in Action
One of Vietnam’s largest beverage companies runs depot-based distribution to thousands of small retail points a day, using mixed fleets of vans, trucks and motorbikes. Before the change, planning ran on Excel, retail points had no validated delivery location and trip-close reconciliation was manual, all of which pushes administrative work onto the driver and out of the productive part of the shift. After route planning and dispatch, orders per delivery trip rose 22%, end-of-day reconciliation time fell 60% and route planning time fell 35%.
The reconciliation figure is a driver figure as much as an office one. Sixty percent less time closing a trip is time returned to the shift, and it is the least visible kind of productivity improvement because it never appears in a stop count.
A global lottery operator running field service across more than 25 US states, with per-jurisdiction contracts, labor laws, SLA windows and technician skill requirements, reduced SLA penalty risk by 20% and fuel spend by 18% through field service dispatch and scheduling. The jurisdictional structure there is the transferable part: allocation that respects per-state rules and per-person qualifications is the same capability an alcohol distributor needs at the doorstep, applied to a different rulebook.
Common Mistakes in Beverage Driver Management
Scoring drivers on distance. In our model six of eight drivers changed rank by two or more places when measured on handling instead, which means coaching and incentives built on the distance ranking are largely misdirected.
Comparing drivers across route types. A scorecard that does not normalize for territory difficulty ranks the route rather than the person, and it reliably punishes the drivers working the hardest accounts.
Keeping qualifications outside dispatch. A certification that the allocation engine cannot read will eventually be missing on a busy morning, and in alcohol that is a license exposure rather than a service miss.
Treating account familiarity as inefficiency. Rotating drivers looks efficient on a distance model and costs minutes at every stop, because knowing the store is worth more than being nearer to it when handling dominates the clock.
How Locus Approaches Beverage Driver Management
Locus, the world’s first Decision-Intelligent, Agentic TMS, holds driver qualifications, certifications, availability and account service history inside the same constraint set that the allocation engine solves against, evaluated across more than 250 real-world operating constraints. That is the structural reason a jurisdiction rule or an expired certification becomes something the system will not assign against, rather than something a supervisor is expected to notice.
Execution is captured where it happens. The driver app carries the day’s plan, the account’s receiving instructions, the proof of delivery requirements including condition photographs, and the returnable asset counts, which is what makes both the compliance record and the handling measurement possible without additional administration. The Dispatch agent holds allocation and reallocates as conditions move, and DiSCO governance mechanisms including Explainability, Traceability and Autonomy Levels determine which decisions run without a human, which matters when allocation affects both driver earnings and license exposure.
Locus has been recognized by Gartner for seven consecutive years across multiple research categories, including Representative Vendor status in the 2026 Gartner Hype Cycle for Supply Chain Execution and Logistics Technologies and the 2026 Gartner Market Guide for Multicarrier Parcel Management Solutions, where ShipFlex is featured as a Representative Vendor. QKS Group positions Locus as the Leader in its SPARK Matrix for Transportation Management Systems 2025, and G2 ranked Locus number one in Route Planning in its 2026 Best Software Awards. The platform has run more than 1.5 billion deliveries for 360+ enterprise customers across 30+ countries at 99.99% uptime.
In October 2025, Ingka Investments, the investment arm of Ingka Group, the world’s largest IKEA retailer, acquired Locus. Locus continues to operate independently.
The test worth running on your own operation takes one afternoon and no new system. Take last quarter’s driver scorecard, then re-rank the same drivers on cases moved per paid hour within route type. If the order changes substantially, and in our model it changed for six drivers in eight, then every decision built on the original ranking deserves a second look, starting with who you have been coaching and who you have been promoting. Locus holds qualifications and service history in the allocation constraint set against 250+ constraints. Talk to a Locus specialist about beverage driver management.
| Also Read: Top Direct Store Delivery Software Solutions |
|---|
FAQs
How is driver management different for beverage routes? The work is dominated by handling rather than driving. A beverage driver makes many more stops per shift than a typical last-mile driver, moves hundreds of cases, performs merchandising at the shelf and cooler, and where alcohol is carried performs a legal age check at the door. Scorecards built for parcel driving measure the smaller part of that.
What should a beverage driver scorecard measure? Cases or units handled per paid hour as the primary productivity measure, normalized for route type, with deliveries refused at the account and compliance failures alongside it. In our illustrative model, six of eight drivers changed rank by two or more places when scored this way rather than on miles per stop.
Why does scoring drivers on distance mislead? Because distance largely reflects the geography of the route rather than the performance of the driver. Two drivers with identical mileage and on-time records differed by roughly a quarter in cases moved per paid hour in our model, and the conventional report would show them as equivalent.
Who is responsible if alcohol is delivered to a minor? The licensee, including where a third-party delivery service made the delivery. California’s ABC treats such a service as an agent operating under the licensee’s privileges and can pursue disciplinary action against the license as if the sale had occurred on the premises, with enforcement running minor-decoy operations at the point of delivery.
What compliance checks does a beverage driver need to perform? It depends on jurisdiction, which is the operational difficulty. Utah’s 100% ID law, effective 1 January 2026, requires an identification check for every alcohol purchase regardless of apparent age, removing previous age-appearance discretion. A multi-state distributor therefore needs per-jurisdiction rules rather than one national policy.
Does driver familiarity with accounts actually matter? Materially, because service time is most of the beverage route clock. A driver who knows the receiving door, the cooler layout, the signing process and the display standard completes the stop faster than an equally capable driver who does not, which is an argument for stability that distance-based optimization tends to remove.


General
Beverage Delivery Experience in 2026: Turning Retail Delivery Into a Retention Channel

Sep 21, 2026
Eight hours of delivery-window uncertainty forces a retail account to hold 55% more cover. Predictability is shelf-space economics, not sentiment.
Read more
General
Fleet Utilization Planning for Beverage Distributors in 2026: Sizing for Peaks Without Overspending

Sep 21, 2026
The cost-minimizing beverage fleet covered only 42% of days in our model. Sizing to peak cost 28% more. Here is where the owned-versus-flex line actually sits.
Read moreInsights Worth Your Time


















Driver Management for Beverage Routes in 2026: Physical Load, Compliance and High-Frequency Stops