


General
Supply Chain Analytics: Key Importance Explained

Key Takeaways
- High last-mile delivery costs account for 53% of total shipping expenses, with inefficient routing and poor optimization directly impacting retailer profitability by up to 26%.
- Advanced analytics enables real-time tracking of key metrics like wait times, travel times, and first attempt delivery rates to identify and address specific causes of delivery delays.
- E-commerce growth demands flexible operations, with delivery volumes expected to increase 78% by 2030, leading to 36% more delivery vehicles in major cities.
- Locus’s dispatch management software helps businesses optimize routes while considering real-world constraints, enabling data-driven decisions through actionable delivery metrics and performance insights.
As the American baseball league is about to begin, let us remind ourselves of the one book that transformed baseball, sports, and even business management in the past two decades, “The Art of Winning an Unfair Game” by Michael Lewis.
You can easily relate to the movie that was inspired by this book- Moneyball. All it took Billy Beane from Oakland A’s to break the myth that more money can win more games was data.
Optimal decisions are necessary for your businesses to compete among big names in last-mile fulfillment and win over them like Billy Beane.
Last-mile delivery is a number-crunching game filled with hyper-complex mathematical operations. It is nearly impossible to manually chart the best plan for complex and time-consuming last-mile delivery, even in simple contexts.
Your business needs data that reflects on-ground reality to build cost-effective plans for the final mile, and the need for advanced supply chain analytics arises here!
What is supply chain analytics?
Supply chain analytics is the practice of collecting, integrating, and analyzing supply chain data using mathematics, statistics, AI, and software to improve how goods, information, and money move from suppliers to customers. This definition aligns with how industry bodies such as ASCM and analytics providers describe the discipline: using large sets of business data to make better supply chain decisions.
In practice, supply chain analytics turns fragmented data from ERP, WMS, OMS, TMS, telematics, GPS, and delivery management platforms into decisions that improve cost-to-serve, service levels, asset utilization, and customer experience. It also supports operational visibility models such as supply chain control towers, where teams monitor exceptions, risks, delays, and performance across the network in near real time.
For last-mile logistics teams, supply chain analytics means moving beyond static reports. It helps answer operational questions such as:
- Which routes are increasing cost per order?
- Where are SLA breaches concentrated?
- Which delivery zones have the highest failed delivery rates?
- Which fleets, drivers, or depots are underutilized?
- How accurate are ETAs compared with actual arrival times?
- Which time slots can be promised without overloading delivery capacity?
- Which orders are at risk of delay before the customer complains?
Supply chain management is the execution of the end-to-end flow of goods, information, and money. Supply chain analytics is the decision layer that helps teams improve that execution.
Why supply chain analytics matters in 2026
In 2026, supply chain analytics is no longer a back-office reporting function. It is becoming a core operating capability for enterprises that need to control cost, improve delivery speed, reduce risk, and respond to volatile demand.
Several market signals show why analytics maturity is rising:
- 95% of organizations report increased spending on supply chain analytics, and 95% plan to further increase investments over the next two years, according to Gartner.
- 50.6% of organizations report adoption of real-time data-sharing platforms, making them a widely implemented part of the digital supply chain collaboration stack.
- 56% of organizations report high AI readiness in supply chain operations.
- 86% of surveyed organizations say that establishing a formal data-and-analytics governance function is necessary, according to ISM.
- The share of companies reporting that analytics-driven decision-making is “very important” in supply chain planning rose to 47%.
The message is clear: supply chain analytics has moved from “nice to have” to a competitive requirement. Businesses that can connect data to daily decisions will respond faster, serve customers better, and manage cost more effectively.
The five types of supply chain analytics
Supply chain analytics is often grouped into four core types: descriptive, diagnostic, predictive, and prescriptive analytics. Some advanced teams also use cognitive or AI-driven analytics that continuously learns from operational outcomes.
| Type of analytics | What it answers | Supply chain example | Last-mile example |
| Descriptive analytics | What happened? | Inventory levels, stockout rate, OTIF, fill rate, lead time, forecast accuracy | Cost per order, route completion rate, dwell time, First Attempt Delivery Rate, fleet utilization |
| Diagnostic analytics | Why did it happen? | Root-cause analysis for supplier delays, demand forecast misses, or warehouse bottlenecks | Identifying whether delays came from poor sequencing, traffic, address quality, driver idle time, or warehouse loading time |
| Predictive analytics | What is likely to happen? | Demand forecasting, stockout prediction, supplier risk scoring, disruption modeling | Forecasting delivery exceptions, ETA risk, capacity shortfalls, and SLA breach probability |
| Prescriptive analytics | What should we do next? | Recommended replenishment quantities, sourcing changes, inventory rebalancing | Optimal routes, driver assignments, re-routing, time-slot changes, and proactive customer alerts |
| Cognitive / AI-driven analytics | How can decisions improve continuously? | Machine learning models that improve forecast accuracy or detect anomalies | ETA learning, route performance improvement, automated dispatch decisions, and exception prioritization |
Supply chain analytics vs. traditional supply chain management
Traditional supply chain management focuses on planning and executing the movement of goods through sourcing, manufacturing, warehousing, transportation, delivery, and returns. It answers the operational question: How do we move products from origin to customer?
Supply chain analytics answers a different question: How do we improve every decision in that flow using data?
| Area | Traditional supply chain management | Supply chain analytics |
| Primary focus | Execution of supply chain operations | Decision intelligence across operations |
| Data usage | Periodic reports, manual analysis, historical performance | Integrated, real-time, predictive, and prescriptive insights |
| Planning approach | Rules, experience, fixed assumptions | Data-backed models, forecasts, optimization algorithms |
| Response to disruption | Reactive firefighting | Scenario modeling, risk prediction, proactive action |
| Typical outputs | Schedules, purchase orders, shipment plans, delivery routes | Forecasts, recommendations, alerts, optimization plans, KPI dashboards |
| Business impact | Operational continuity | Cost reduction, service improvement, risk mitigation, resilience |
The strongest supply chains combine both. Operations teams still need sound processes, disciplined execution, and experienced managers. But analytics gives those teams the evidence, forecasts, and recommendations needed to make better decisions faster.
5 signs you need advanced supply chain analytics to make better last-mile decisions
Before Billy Beane, all baseball clubs thought more money was critical to winning big and having the edge over the opponents.
Billy Beane felt baseball suffered from an epidemic failure due to baseball theorists, age-old myths, and prejudices. This led him towards last mile delivery analytics to make optimal decisions in selecting and managing players.
With e-commerce user penetration expected to surpass 80% in 2023 and close to 85% in 2027, businesses need operational flexibility to manage vast volumes of shipments. Investing in advanced analytics helps your companies manage these high volumes of shipments flexibly and efficiently.
Last-mile decisions without data are mere guesswork that can add to costs and kill your brand reputation. If your businesses are struggling from one, a few, or all of the five problems below, it means your business needs advanced supply chain analytics.
1. High last-mile delivery costs
Online sales are capturing customers’ attention like never before. And the numbers prove it. Before the pandemic hit, retail e-commerce sales were 3.35 trillion dollars. A study says retail e-commerce sales will reach 8.1 trillion dollars by 2026.
When there is a sudden increase in online sales and your business does not focus on optimizing the delivery costs, it can heavily impact your profitability. A Capgemini study has found that absorbing a part of last-mile delivery cost and not optimizing it will hurt retailers’ profitability by 26%.
Cost is the primary obstacle to attaining a healthy profit margin from last-mile delivery operations. Final-mile delivery contributes to 53% of the total cost of shipping. A few bottlenecks and inefficiencies can make it more expensive and reduce profit margins.
Advanced supply chain analytics is the need of the hour to spot these bottlenecks and inefficiencies and work on them. It helps you find answers to some plaguing questions about increasing delivery costs. A few of these questions are:
- What was the hour of the day that had the highest number of deliveries?
- What time of the day are deliveries made quicker and more cost-effective?
- Which delivery zone or region incurs high last-mile delivery costs?
- What is my time per delivery?
- Is my order accuracy rate getting lower due to missed deliveries?
- How much cost is my business incurring due to inefficient schedules?
- Are there any inefficient or manually planned routes contributing to high delivery costs?
- Which driver has the highest average idle time?
- Is cost per mile increasing during peak season?
- Who are the drivers outperforming and underperforming?
- What was my Service Level Agreement (SLA) adherence during peak season?
- How much does it cost to service and visit all the stops on the route?
- How much fuel do vehicles consume in a day?
- What is the profit per mile for a route?
By using advanced supply chain analytics, you can get answers to critical business questions in the final mile. It is a unique microscope that allows your business to obtain a comprehensive picture of your last-mile logistics costs. It assists your stakeholders and delivery managers to make informed decisions, rectify logistical weaknesses, and improve delivery efficiency, by minimizing delivery costs.
2. Increasing delivery delays
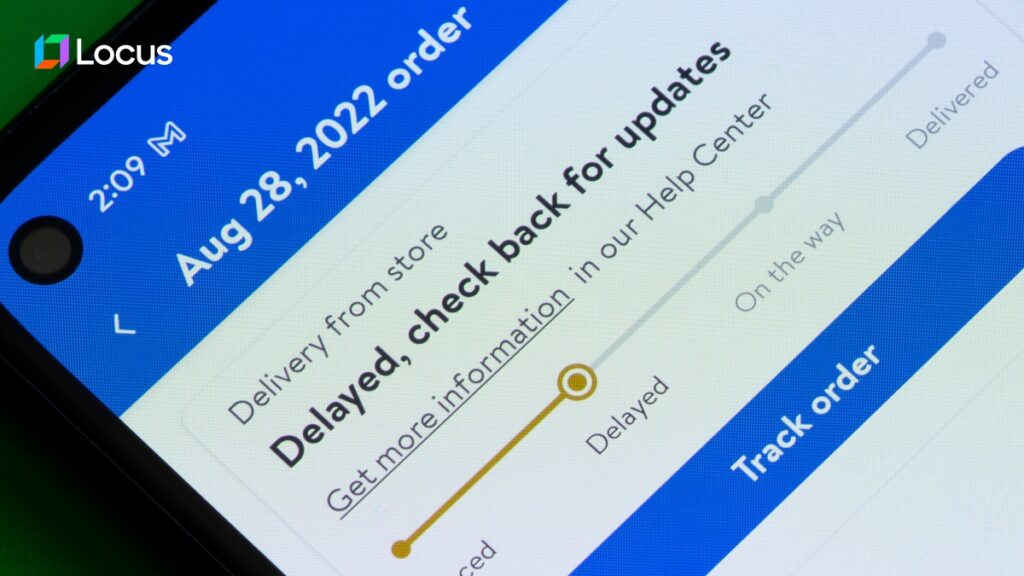
With increased consumer interactions on social media, businesses must be honest and responsive about delivery delays. So today, a few delayed deliveries can snowball into a fall in your brand reputation.
Road closures, traffic, vehicle breakdowns, or incorrect addresses contribute to delivery delays. It is crucial to consider these issues for your drivers to make on-time deliveries. Only data can help you find what stops your on-ground workforce from making deliveries on time and solve them.
Advanced analytics is the magnetic compass that rightly shows where your delivery delays are happening. It provides critical delivery insights through different metrics and some of which include:
| Delivery insights related to delays | What does it mean |
|---|---|
| Wait time | Amount of inactive time on-ground staff spend waiting |
| Actual travel time | The actual time a driver takes to travel through routes and complete deliveries |
| Estimated travel time | Planned travel time for the route |
| Total service time | Estimated time spent to serve all stops on the route |
| Actual service time | Actual time spent in servicing all addresses in a route |
| Dwell time | Planned or designated waiting time at destination or warehouse |
| Detention time | When dwell time crosses the limit, the excess time than the allowed dwell time is detention time |
| Time Under the Roof | Total time spent by vehicles waiting to load/unload shipments in warehouses. |
| On-time In-Full | Measures whether all order items have been delivered to respective destinations on time. |
With the help of advanced supply chain analytics, you can easily track the percentage of First Attempted Delivery Rates (FADR). This helps you know if your first attempted deliveries are on time and reduce the likelihood of reattempted deliveries.
3. Difficulty in serving customers in their preferred time slots
A major concern for customers is when they perceive that a business does not value their choices. This can cause them to feel anxious about the delivery of their product or service, ultimately hindering the growth prospects of the business.
Before going further, we will touch upon the meaning of delivery anxiety. Delivery anxiety is customers’ prolonged fear after placing an order when they aren’t provided timely updates on order fulfillment. This can be extended to not sharing drivers’, and delivery agents’ details and not providing the customers with options to reschedule deliveries even after their dispatch. Further, not giving customers a choice to select their time slot for receiving orders makes deliveries unpredictable.
Businesses need advanced analytics on time slots that customers prefer to serve them better. With analytical insights on time slots, it becomes easier to assign the right fleet and fully use it.
Is there a way forward to get this done? The answer is a definite “Yes”.
With the help of delivery-linked checkout, customers can choose their preferred time slots. As these time slots are connected to fleet’s capacity usage and availability, it becomes easier for dispatch managers to deliver orders to customers at their preferred time while fully utilizing fleet capacity.
4. Need for prediction and forecasting
As a dispatcher or stakeholder, it is necessary to contribute to the strategic decisions of your business. To build a strategic framework and roadmap for last-mile delivery, your business needs the help of data. It’s necessary to have critical forecasts and predictions to help you chart the right plans for your upcoming deliveries.
There are some periods in a year when demand for deliveries increases. It may be during weekly holidays, special government holidays, or the much-celebrated peak season. To plan for these critical times and direct your resources, you need some crucial forecasts and predictions for the last mile like:
- Operational fleet size for the next month
- Fleet mix for the coming peak season sales
- Number of drivers to handle demand peaks
- Expected Time of Arrival between each stop
- Number of stops that drivers may serve for the next quarter
- Total vehicle capacity required for high-order volumes
- Average service time planned for the next week
Advanced supply chain analytics helps you know if your weak spots or areas of concern will improve shortly. With its predictive capabilities, you may know where immediate intervention is required and anticipate shifts in demand. It also enables you to find delivery exceptions of Service Level Agreement (SLA) breaches that are likely to occur. This helps you alert customers when there are possibilities of delays for upcoming deliveries.
5. Inefficient routes
If your vehicles take longer distances and incur high costs and more time to travel, it means you are spending costs on wasted time and miles. As you work on a manual route plan, you end up spending unnecessary hours on the process of planning routes. This leads to delays in picking and packing operations from the warehouse, which incurs overtime costs. But route optimization can provide answers to these issues.
Providing the route with the shortest distance is not what an optimized route is all about. With insights into numerous delivery constraints, advanced analytics from route optimization software acts as a pillar to plan the optimal routes for your drivers. Some of the insights on real-world delivery constraints include:
- Multiple time windows per stop
- Regional regulations of local authorities
- Maximum number of stops per route
- Route distance
- Route duration limits
- Proximity to the depot
- Loading and unloading time
- Driver breaks/ Unavailability
- Vehicle capacity utilization
- Scheduling of return orders from customers
- Expected Time of Arrival (ETA)
- Customer-preferred time windows
As drivers pick up multiple orders from multiple sources and deliver them to multiple destinations, there is a higher chance of orders getting mixed up. What is the solution to this issue? The answer lies in multi-stop route planning.
With multi-stop route planning, your business can ensure that there are multiple orders for one pickup or multiple pickups for one dropoff leading to minimal mistakes. It generates real-world-ready optimal routes after factoring into the data of all real-world constraints. Combining its power with advanced analytics, multi-stop route planning makes it easier to deliver multiple orders to multiple locations without orders getting mixed up.
Key application areas of supply chain analytics
Supply chain analytics creates value across the full supply chain, not only in last-mile operations. High-impact use cases typically fall into seven areas.
1. Demand forecasting
Demand forecasting uses historical sales, promotions, seasonality, market signals, and external data to predict future demand by product, region, channel, and customer segment.
Better demand forecasting helps teams:
- Reduce stockouts
- Avoid excess inventory
- Improve production planning
- Align replenishment with expected demand
- Improve service levels during promotions and peaks
2. Inventory optimization
Inventory optimization uses predictive analytics to determine how much stock should be held, where it should be positioned, and when it should be replenished.
It improves decisions around:
- Safety stock
- Reorder points
- Inventory turns
- Slow-moving inventory
- Stock balancing across locations
- Working capital tied up in inventory
3. Transportation and logistics analytics
Transportation analytics helps reduce freight cost, improve route efficiency, and increase carrier or fleet performance. For last-mile teams, this includes route optimization, delivery density, ETA accuracy, service time, failed delivery analysis, and cost per stop.
Common transportation KPIs include:
- Cost per mile
- Cost per order
- On-time delivery
- OTIF
- Route adherence
- Empty miles
- Vehicle utilization
- Carrier performance
4. Supplier performance analytics
Supplier analytics measures lead time, reliability, cost, quality, responsiveness, and risk. It helps procurement and supply chain teams identify which suppliers are reliable, which create disruption risk, and where sourcing strategies need adjustment.
Metrics include:
- Supplier on-time delivery
- Lead time variability
- Defect rate
- Fill rate
- Purchase price variance
- Supplier risk score
- Contract compliance
5. Risk analytics and disruption modeling
Supply chain risk analytics combines internal data with external signals such as weather, labor disruption, geopolitical risk, fuel prices, and supplier financial health.
It helps teams answer:
- Which suppliers or lanes are vulnerable?
- Which facilities are single points of failure?
- What happens if a port, region, supplier, or carrier is disrupted?
- Which backup suppliers or alternate routes should be activated?
- How much safety stock is justified by the risk?
6. S&OP and IBP analytics
Sales and operations planning and integrated business planning rely on aligned data across demand, supply, finance, and operations. Analytics helps teams evaluate trade-offs between revenue, service levels, inventory, and cost.
For example, analytics can show whether a promotion will create capacity constraints, whether inventory can support forecast demand, or whether logistics cost will erode margin.
7. Sustainability and ESG analytics
Supply chain analytics also supports sustainability reporting and decarbonization initiatives. It can track delivery distance, fuel consumption, empty miles, fleet mix, load utilization, and emissions by lane or delivery zone.
The need is increasing. In central Tokyo’s 23 wards, e-commerce distribution volumes are forecast to rise 85% by 2030, requiring a 71% increase in delivery vehicles and a 25% increase in total delivery distance, according to the World Economic Forum. The same report projects a 20% increase in CO? emissions from last-mile logistics in central Tokyo by 2030.
Analytics helps organizations identify where route optimization, consolidation, EV deployment, micro-fulfillment, and capacity planning can reduce environmental impact without weakening service levels.
Benefits of supply chain analytics
Supply chain analytics delivers measurable value when insights are connected to execution. The biggest benefits include:
Lower operating costs
Analytics identifies cost drivers such as inefficient routes, excess dwell time, poor load utilization, low route density, high reattempt rates, and expensive delivery zones. This helps teams reduce unnecessary miles, labor hours, fuel usage, and overtime.
Better service levels
By monitoring OTIF, SLA adherence, ETA accuracy, and delivery exceptions, businesses can improve reliability and customer communication. Analytics also helps prioritize at-risk orders before they become customer complaints.
Improved forecast accuracy
Predictive models help demand planners anticipate demand by SKU, location, channel, and time period. This improves replenishment, production planning, and inventory allocation.
Reduced inventory waste
Inventory analytics helps teams avoid overstocking, stockouts, and unnecessary transfers. It supports better safety stock policies and improved inventory turns.
Stronger resilience
Risk analytics helps organizations identify vulnerabilities before disruption occurs. Teams can model scenarios, evaluate backup suppliers, adjust routes, and allocate inventory more intelligently.
Higher asset utilization
Logistics teams can use analytics to improve vehicle utilization, driver productivity, depot throughput, and fleet mix. This is especially important for enterprises managing owned fleets, third-party carriers, gig drivers, ICE vehicles, and EVs.
Better cross-functional decisions
Supply chain analytics creates a shared view of trade-offs across operations, finance, sales, procurement, and customer experience. This improves S&OP and IBP decisions by connecting service, cost, revenue, and capacity.
Key features of supply chain analytics software
Effective supply chain analytics software should do more than visualize data. It should help teams act on insights across planning and execution.
Data integration
The platform should connect data from ERP, WMS, OMS, TMS, telematics, GPS, carrier systems, e-commerce platforms, and delivery management tools.
Real-time dashboards
Real-time dashboards help teams monitor exceptions, orders, routes, capacity, inventory, and service levels. Visual formats may include heatmaps of late shipments, route performance charts, depot dashboards, and control tower views.
Predictive modeling
Predictive capabilities forecast demand, ETA risk, capacity shortfalls, supplier disruption, stockout probability, and delivery exceptions.
Prescriptive recommendations
Prescriptive analytics recommends what teams should do next. This may include route changes, driver assignments, replenishment decisions, delivery slot changes, or customer notifications.
Scenario modeling
Scenario planning helps teams evaluate what happens if demand spikes, a supplier fails, fuel prices increase, a lane is disrupted, or fleet capacity becomes constrained.
KPI monitoring
The system should track metrics such as forecast accuracy, fill rate, inventory turns, OTIF, lead time, cost per order, cost per mile, SLA adherence, route adherence, FADR, and fleet utilization.
AI and machine learning
AI and machine learning can improve ETA accuracy, detect anomalies, identify recurring route problems, classify delivery exceptions, and improve forecast models over time.
Governance and data quality controls
Analytics is only as good as the data behind it. Strong governance is essential, especially as 86% of surveyed organizations say formal data-and-analytics governance is necessary.
How to implement supply chain analytics
A successful supply chain analytics program depends on data quality, integration, process design, and adoption. Tools matter, but they are not enough.
Step 1: Define the business problem
Start with a high-value use case. Examples include reducing last-mile costs, improving OTIF, increasing forecast accuracy, reducing stockouts, improving fleet utilization, or reducing delivery exceptions.
Step 2: Identify the required data
Map the data needed for the use case. For last-mile analytics, this may include order data, route plans, actual GPS traces, delivery timestamps, service times, driver schedules, vehicle capacity, customer time windows, failed delivery reasons, and fuel usage.
Step 3: Integrate systems
Connect ERP, WMS, OMS, TMS, telematics, and delivery management platforms. Integration reduces manual reporting and creates a single operational view.
Step 4: Build descriptive dashboards
Begin with dashboards that show what happened. Track baseline KPIs before moving into advanced modeling.
Step 5: Add diagnostic analysis
Use root-cause analysis to understand why KPIs are underperforming. For example, late delivery may be caused by route sequencing, warehouse loading delay, address quality, driver idle time, or unrealistic time-slot promises.
Step 6: Introduce predictive models
Use predictive analytics to forecast demand, route risk, SLA breaches, capacity shortfalls, and delivery exceptions.
Step 7: Operationalize prescriptive decisions
Embed recommendations into workflows. Analytics should not sit in a dashboard that no one uses. It should influence routing, dispatch, inventory planning, customer alerts, and exception management.
Step 8: Scale and govern
Create clear ownership for data quality, model monitoring, KPI definitions, and decision rights. This is especially important because only about 25% of companies have reached any stage of AI or advanced digital tool implementation across their end-to-end supply chain, and roughly 10% report fully implemented AI solutions.
Advanced analytics: Bedrock for better last-mile decisions
With demand for last-mile delivery expected to grow by 78% by 2030, the number of delivery vehicles in the top 100 cities will increase by 36%. This increase in delivery vehicles will increase congestion by 21%. – The future of the last-mile ecosystem, World Economic Forum 2020.
As the demand for last-mile delivery is expected to steep, enterprise businesses are looking to digitalize their last-mile logistics operations. With enterprises leveraging automation for repetitive tasks and regular decisions, data-driven decision-making will occupy the center stage soon.
The best way to make data-driven decisions is by investing in a technology that assists the dispatch management efforts of your business. One such technology that supports dispatch management operations is Locus.
With Locus’ dispatch management software, your stakeholders can quickly source on-ground data and delivery metrics to evaluate delivery performance. It helps your delivery managers to create engaging visual representations of actionable insights. These insights help your business elevate the productivity levels and efficiency standards of deliveries. Finally, its key delivery metrics help your business identify and rectify the bottlenecks and make upcoming deliveries better than the previous ones.
Want to use advanced analytics to plan, manage and strategize your last-mile delivery operations ahead of time? Talk to our experts now!
References:
https://www3.weforum.org/docs/WEF_Future_of_the_last_mile_ecosystem.pdf
https://www.statista.com/statistics/379046/worldwide-retail-e-commerce-sales/
https://www.capgemini.com/wp-content/uploads/2019/01/Report-Digital-%E2%80%93-Last-Mile-Delivery-Challenge1.pdf
https://www.insiderintelligence.com/insights/last-mile-delivery-shipping-explained/


General
A Modern TMS Stores Results, Not Decisions: Why the Decision Layer is the Part That Matters

Aug 28, 2026
A TMS has a data model for orders, shipments, and invoices, and none for decisions. Six things that become impossible as a result, and what a decision layer changes.
Read more
General
Logistics vs Supply Chain Management: Key Differences Guide

Aug 29, 2026
Understand the critical differences between logistics and supply chain management. Learn when to optimize each for maximum business impact and ROI.
Read moreInsights Worth Your Time




















Supply Chain Analytics: Key Importance Explained