


Fleet Optimization
What Is Fleet Utilization? Key Metrics & Importance in 2026

Key Takeaways
- Fleet utilization measures the percentage of available time, distance, or capacity that vehicles spend on productive work. A healthy benchmark is approximately 70%, with high-performing fleets targeting 75–85% through telematics and AI.
- Three calculation approaches—time-based, distance-based, and capacity-based—give logistics leaders a complete picture of fleet efficiency across different operational contexts.
- Fleet utilization metrics like miles traveled, fuel consumption, time utilization, drop density, and empty miles are essential for identifying operational inefficiencies and optimizing delivery performance.
- Right-sizing fleet operations requires balancing four components: correct quantity of vehicles, optimal vehicle locations, appropriate vehicle types, and proper timing of availability.
- Technology delivers measurable gains: average fuel savings from fleet technology have doubled to 16%, and 47% of GPS fleet tracking users realized positive ROI in less than a year.
- Locus’s fleet management software—trusted by 360+ leading enterprises—provides advanced analytics and automated load assignment to maximize vehicle utilization across 250+ real-world constraints.
Fleet managers across 3PL, retail, and manufacturing operations face a complex web of daily constraints—balancing cost, time, vehicle capacity, and customer expectations. Whether you lead logistics at a courier, express, and parcel (CEP) company or oversee distribution for a retail chain, every idle vehicle erodes margin and every underloaded trip represents lost revenue.
Improving scheduling efficiency and maximizing fleet utilization is crucial for operational success and profitability. In 2026, with 74% of fleet managers planning to adopt AI for efficiency and automation and 61% of fleets prioritizing lower total cost of ownership, the pressure to extract more from existing assets has never been greater.
This article provides actionable strategies, formulas, industry benchmarks, and technology guidance—drawn from extensive research and real-world fleet operations—to help logistics leaders achieve measurable improvements in fleet utilization. Understanding what is route optimization is a critical prerequisite, as it directly feeds into utilization outcomes.
What Is Fleet Utilization?
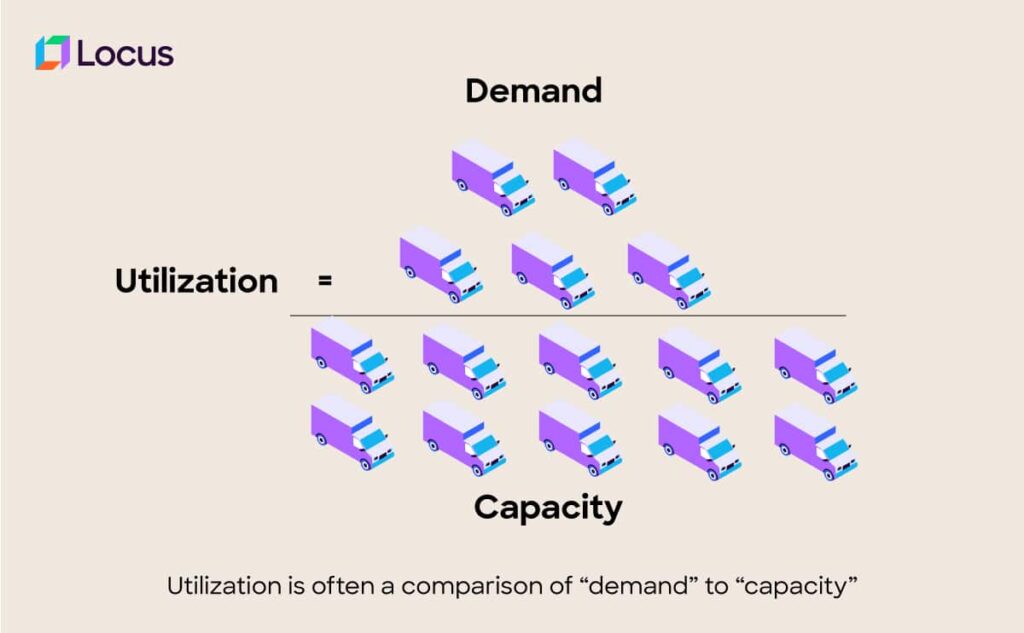
Fleet utilization measures how effectively a company converts available vehicle time, distance, or capacity into productive work. It is a comparison of actual demand served against total fleet capacity over a defined period.
However, it is not a single number. There is an optimum fleet utilization level for each location, each class of vehicle, and each time window. A 3PL operating multi-client routes faces different utilization dynamics than a retail chain running fixed store replenishment schedules or a manufacturing operation coordinating inbound raw material shipments.
Capacity and demand change daily, which means the approach to managing fleet utilization must be equally dynamic. As a Head of Logistics at a CEP company, you may define it by loaded miles per route. As a fleet director for a retailer, you may focus on time spent delivering versus time spent idle at loading docks. Both perspectives are valid—and both are necessary for a complete operational picture.
Fleet Utilization vs Availability vs Uptime
Fleet utilization, availability, and uptime are related but not interchangeable. Treating them as the same metric can make a fleet appear healthier than it is.
| Metric | What It Measures | Operational Question It Answers |
| Fleet utilization | How much available time, distance, or capacity is converted into productive work. | Are we using fleet assets efficiently to serve demand? |
| Availability | Whether a vehicle is ready and eligible to be assigned to work. | Can this asset be deployed when needed? |
| Uptime | Whether a vehicle is mechanically or technically operational. | Is this asset functioning and not broken down? |
A vehicle can have high uptime but low utilization. For example, a van may be roadworthy, fuelled, and available in the yard, but if it is not assigned to a route or is waiting for orders, it is not productively utilized.
Fleet Utilization vs Vehicle Utilization vs Asset Utilization
| Term | Typical Scope | Example Use Case |
| Fleet utilization | Aggregate view across all vehicles in a fleet, region, depot, or business unit. | Comparing utilization across distribution centres or delivery zones. |
| Vehicle utilization | Performance of an individual vehicle or vehicle class. | Identifying vans, box trucks, or trailers that are consistently underused. |
| Asset utilization | Broader measure covering vehicles, trailers, equipment, containers, or other logistics assets. | Measuring whether high-value assets are generating productive throughput. |
How Uptime Differs From Utilization
Uptime is a reliability metric. Utilization is a productivity metric. A vehicle with 98% uptime may still have poor utilization if demand is low, routing is inefficient, or dispatchers lack visibility into available assets. Conversely, a highly utilized vehicle with weak uptime performance may be running too hard and creating maintenance risk.
Why Is Fleet Utilization Important?
A well-utilized fleet directly improves productivity, reduces costs, and boosts profitability. Here are the critical reasons fleet utilization matters for every logistics-dependent operation.
Ensure Optimal Usage of Fleet Assets
A parked truck attracts only storage and depreciation costs. An empty running truck generates fuel costs without earning revenue. Maximizing vehicle capacity utilization helps increase revenue potential with fewer resources—a priority for 61% of fleets focused on lowering total cost of ownership.
Manage and Reduce Delivery Costs
Fleet managers must focus on delivery costs to minimize unnecessary expenses associated with fulfilling orders. By understanding where costs accumulate—fuel, idle time, deadhead miles, maintenance on underused vehicles—leaders can make targeted reductions. Understanding how delivery logistics software improves fleet utilization is a critical step toward controlling these cost drivers.
Right-Size the Fleet for Operations
Analyzing fleet capacity utilization helps a company right-size its fleet by answering two critical questions:
- How many vehicles are needed to meet business demands?
- What are optimum miles driven (over a set timeframe) so each vehicle is adequately utilized?
Four Components of a Right-Sized Fleet:
| Component | Key Question |
|---|---|
| Right quantity of vehicles | Is there a sufficient number of vehicles available to meet all delivery requirements efficiently? |
| Right location of vehicles | Are vehicles positioned close enough to assigned drivers and delivery zones for rapid deployment? |
| Right type/class of vehicles | Does the fleet contain the appropriate vehicle classes for specific load, terrain, and delivery requirements? |
| Right time of vehicle availability | Are vehicles accessible and operational when delivery tasks are assigned to drivers? |
Enable Data-Driven Fleet Decisions
With 95% of fleets now using vehicle tracking software and 73% prioritizing vehicle ordering and replacement cycles, utilization data has become the foundation for strategic fleet investment. Without accurate utilization metrics, fleet managers cannot determine whether to retire, replace, or add vehicles—leading to either over-fleeting (excess cost) or under-fleeting (missed revenue).
Design a Multi-Pronged Strategy to Enhance Fleet Productivity
The profitability of CEP companies depends on fleet productivity. Fleet managers design multi-pronged strategies to maximize revenue from fleet optimization by analyzing:
- Driving habits, performance, and behavior patterns
- The gap between vehicle specifications and actual usage
- Vehicle-to-driver matching based on operational requirements
- Route optimization benefits across different business segments
How Do I Increase My Fleet Fuel Efficiency?
Fuel is one of the biggest operating costs in fleet management. Improving efficiency starts with monitoring driver behavior and route performance. Metrics such as idle time, harsh acceleration, and average speed reveal precisely where fuel wastage occurs.
Studies show that aggressive driving can reduce fuel economy by 10–30%, depending on conditions. Meanwhile, average fuel savings from fleet technology have doubled to 16% between 2021 and 2025, underscoring the compounding value of technology investment.
Preventive maintenance also plays a significant role. Maintaining correct tire pressure, clean air filters, and tuned engines directly improves mileage. Additional strategies include:
- Installing aerodynamic add-ons like trailer skirts and side fairings
- Using telematics data to identify underperforming vehicles or routes
- Consolidating loads to eliminate partial-capacity trips
- Scheduling deliveries during off-peak traffic windows
Technology further amplifies results. With Locus’s AI-powered dispatch management, fleets can plan fuel-efficient routes, minimize empty miles, and consolidate loads. The platform analyzes real-time traffic, vehicle load, and delivery windows to recommend optimal routes that reduce both distance and idle time.
What Is a Fleet Utilization Rate?
The fleet utilization rate measures how effectively a company uses its available vehicles to meet delivery demand. It shows the percentage of total fleet capacity—measured by time, distance, or load—that is actually being used over a specific period. A high utilization rate indicates efficient operations, while a low one reveals excess capacity or scheduling gaps.
Industry benchmark: A healthy, efficient fleet is generally considered to be in use approximately 70% of the time, allowing adequate room for maintenance, repairs, and demand fluctuation. High-performing fleets leveraging telematics and AI-driven dispatch target 75–85% utilization.
The basic formula is:
Fleet Utilization Rate (%) = (Total Vehicles in Use ÷ Total Vehicles Available) × 100
How to Choose the Right Denominator
The denominator determines what “available capacity” actually means. A utilization report can produce materially different results depending on whether it uses total calendar hours, scheduled shift hours, available vehicle hours, total miles, loaded miles, pallet positions, cubic volume, or rated payload.
The right denominator should match the management question being answered:
| Reporting Objective | Recommended Denominator | Best Use |
| Board-level asset productivity | Total calendar hours or total fleet count | Understanding whether owned assets are being used enough to justify capital investment. |
| Depot or shift performance | Scheduled shift hours | Comparing dispatch efficiency across locations, shifts, or labour plans. |
| Maintenance-adjusted productivity | Available vehicle hours | Excluding vehicles that were legitimately unavailable due to approved maintenance or compliance work. |
| Transport efficiency | Total miles driven | Measuring the share of miles that were loaded, revenue-generating, or order-serving. |
| Load efficiency | Rated vehicle capacity by weight, cube, pallet, or parcel count | Identifying whether vehicles are being dispatched full enough for the operation type. |
Denominator Rules for Utilization Reporting
Consistent denominator rules prevent misleading comparisons across business units. Define rules for:
- Total calendar hours: useful for long-term capital productivity, but harsh for fleets that do not operate around the clock.
- Scheduled shift hours: useful for daily operational reporting where vehicles are expected to be deployed only during planned shifts.
- Available vehicle hours: useful when separating dispatch performance from maintenance or compliance downtime.
- Loaded miles: useful for measuring revenue-generating movement versus total miles.
- Rated capacity: useful for comparing actual payload, cube, pallet positions, or stop count against what the vehicle was designed to carry.
Once selected, the denominator should remain stable across reporting periods unless the operating model changes. If it changes, annotate the report so teams do not mistake a measurement change for an operational improvement.
Should Planned Maintenance Count Against Utilization?
Planned maintenance should be visible in utilization reporting, but it should not be treated the same way as avoidable idle time. A vehicle in a scheduled preventive maintenance window is intentionally unavailable; a vehicle sitting unused because of poor dispatch visibility is underutilized.
A practical approach is to report two views:
- Gross utilization: productive work divided by total fleet capacity, including planned maintenance windows.
- Net operational utilization: productive work divided by capacity available after approved maintenance and compliance downtime.
This distinction helps fleet leaders protect reliability without masking avoidable inefficiency.
However, this metric is most meaningful when paired with performance factors such as miles driven, drop density, and vehicle load. A fleet might report 90% utilization by vehicle count, but if most trips involve empty return legs or partial loads, true efficiency is much lower.
With fleet management software, businesses can monitor these utilization rates in real time, identify underperforming routes, and reassign loads automatically. This not only improves asset usage but also reduces operational costs and improves delivery reliability.
Target Utilization Bands by Fleet Type
There is no universal target utilization rate. The right band depends on route volatility, demand predictability, service-level commitments, maintenance windows, and whether the fleet is owned, leased, contracted, or multi-client.
Use the following bands as operating guardrails, not fixed rules:
| Fleet Type | Typical Target Band | Why the Band Differs |
| Last-mile delivery vans | 70–85% | High stop density and tight customer time windows require spare capacity for failed deliveries, reattempts, traffic, and same-day changes. |
| Box trucks and regional distribution vehicles | 65–80% | Larger loads and dock dependencies make loading, unloading, and turnaround time more material. |
| Linehaul vehicles | 75–90% | Predictable lanes and longer-haul movement can support higher utilization, provided maintenance and driver-hour compliance are protected. |
| Service fleets | 60–75% | Technician availability, emergency jobs, parts availability, and customer appointment windows create more variability. |
| 3PL multi-client fleets | 70–85% | Multi-client pooling improves asset sharing, but contractual SLAs and demand imbalance require buffer capacity. |
Asset-Class Utilization Thresholds for Delivery Fleets
Delivery fleets should set thresholds by vehicle class rather than averaging every vehicle into one number. Last-mile vans, box trucks, refrigerated vehicles, linehaul tractors, trailers, and 3PL pooled assets face different load profiles and duty cycles. A single blended KPI may hide underused high-cost assets or overworked critical vehicles.
How Do You Calculate Fleet Utilization?
Fleet utilization is calculated by comparing how many vehicles—or how much vehicle capacity—is actively used against the total available within a given period. The goal is to understand how efficiently fleet resources are deployed.
Most logistics teams refine the basic calculation by using three distinct approaches:
Fleet Utilization Formulas: Three Approaches
| Approach | Formula | Best For |
| Time-Based | (Total Productive Hours ÷ Total Available Hours) × 100 | Service fleets, construction equipment, and operations with significant idle time. |
| Distance-Based | (Total Loaded Miles ÷ Total Miles Driven) × 100 | Trucking, long-haul logistics, and courier or CEP operations. |
| Capacity-Based | (Actual Load Carried ÷ Rated Vehicle Capacity) × 100 | Last-mile delivery, retail distribution, and parcel logistics. |
Fleet Utilization Calculation Examples
The most useful utilization model depends on what the fleet is trying to improve.
| Calculation Type | Sample Inputs | Formula | Result |
| Time-based utilization | 320 productive vehicle hours across 400 available vehicle hours | (320 ÷ 400) × 100 | 80% |
| Distance-based utilization | 7,500 loaded miles across 10,000 total miles | (7,500 ÷ 10,000) × 100 | 75% |
| Capacity-based utilization | 18,000 parcels carried across 24,000 parcel capacity | (18,000 ÷ 24,000) × 100 | 75% |
These examples show why a fleet can look strong in one dimension and weak in another. A route may be time-efficient but capacity-light, or capacity-efficient but burdened by empty return miles.
Step-by-Step Fleet Utilization Calculator Example
Consider a regional delivery fleet operating 20 vehicles over one day.
Sample inputs
| Input | Value |
| Vehicles scheduled | 20 |
| Shift length per vehicle | 10 hours |
| Total scheduled vehicle hours | 200 hours |
| Productive driving and delivery hours | 150 hours |
| Total miles driven | 2,400 miles |
| Loaded miles | 1,800 miles |
| Rated daily parcel capacity | 12,000 parcels |
| Actual parcels delivered | 9,600 parcels |
Step 1: Calculate time-based utilization
Time-Based Utilization = (150 productive hours ÷ 200 scheduled hours) × 100 = 75%
Step 2: Calculate distance-based utilization
Distance-Based Utilization = (1,800 loaded miles ÷ 2,400 total miles) × 100 = 75%
Step 3: Calculate capacity-based utilization
Capacity-Based Utilization = (9,600 delivered parcels ÷ 12,000 rated parcel capacity) × 100 = 80%
Step 4: Interpret the result
The fleet is productive on capacity, but 25% of distance is still non-loaded movement. The improvement opportunity is not necessarily fewer vehicles; it may be better backhaul planning, improved route sequencing, or multi-stop consolidation.
Example: If 80 out of 100 vehicles are active in a day, the basic fleet utilization rate is 80%. But if half of those vehicles operate under capacity, true capacity utilization may be closer to 60–65%. Breaking utilization down into time-, distance-, and capacity-based formulas gives operators the full story behind their fleet performance.
Supplementary metrics to layer into calculations:
- Time utilization: Percentage of time vehicles spend on active trips versus idle or parked hours.
- Capacity utilization: Average load weight or volume carried compared to total vehicle capacity.
- Distance efficiency: Miles driven on revenue-generating routes versus total miles driven (including deadhead miles).
Using Locus’s analytics dashboard, managers can calculate these utilization ratios in real time, visualize underused vehicles, and optimize dispatch schedules automatically to achieve near-optimal fleet usage.
Common Fleet Utilization Measurement Mistakes
Fleet utilization calculations become unreliable when the underlying definitions are inconsistent. Common mistakes include:
- Counting engine-on time as productive work even when the vehicle is idling, waiting, warming up, or repositioning.
- Comparing depots with different shift calendars without normalising the denominator.
- Treating planned maintenance and unplanned downtime as the same category.
- Measuring vehicle count utilization without checking load, cube, stop density, or revenue contribution.
- Ignoring empty miles and reporting only total miles travelled.
- Mixing owned, leased, contractor, and 3PL capacity without segmenting the data.
- Allowing manual status updates to remain missing, delayed, or inconsistent.
Engine-On Time vs Productive Time
Engine-on time is not the same as productive time. A vehicle can be running while waiting at a dock, queuing at a gate, warming up, idling in traffic, or repositioning without cargo. These states consume fuel and driver hours but do not necessarily create productive delivery output.
For a sharper fleet utilization view, classify time into operational statuses such as assigned, loading, driving loaded, unloading, waiting, idle, maintenance, and out of service. This separates activity from value-creating work.
Fleet Utilization Metrics You Should Be Tracking
To understand how well a fleet is performing, track key metrics across cost-efficiency, productivity, and customer service. The following table provides an at-a-glance reference, followed by detailed breakdowns.
Fleet Utilization Metrics at a Glance
| Metric | Definition | Why It Matters |
| Vehicle Utilization Rate | Percentage of vehicles actively used during daily operations. | Measures asset efficiency and helps identify underutilized or idle vehicles. |
| Revenue & Cost per Truck | Revenue generated compared to operating cost for each vehicle. | Evaluates per-vehicle profitability and operational sustainability. |
| Empty Miles (Deadhead) | Percentage of miles driven without revenue-generating cargo or deliveries. | Highlights inefficiencies and gaps in route optimization. |
| Drop Density | Number of deliveries completed per driver or per route. | Higher density improves route efficiency and reduces fleet requirements. |
| Time Utilization | Distribution of time spent driving, loading, idling, and waiting. | Identifies operational bottlenecks and inefficient workflows. |
| Fuel Consumption | Amount of fuel consumed per mile traveled or per delivery completed. | Tracks transportation cost efficiency and driver behavior patterns. |
| Job History | Historical operational and delivery performance records. | Supports trend analysis and continuous process improvement. |
Minimum Data Model for Utilization Reporting
Accurate fleet utilization reporting requires a consistent data model. At minimum, capture:
| Data Field | Why It Matters |
| Asset ID | Links utilization to a specific vehicle, trailer, or equipment unit. |
| Vehicle class | Enables like-for-like comparison across vans, box trucks, tractors, and specialised vehicles. |
| Driver or operator ID | Connects performance to shifts, skills, and route execution patterns. |
| Status code | Shows whether the asset is available, assigned, loading, driving, idle, in maintenance, or out of service. |
| Start and end timestamps | Calculates duration accurately for each activity state. |
| Location | Identifies depot delays, route deviations, dwell points, and idle hotspots. |
| Work context | Links activity to route, order, shipment, customer, lane, or service type. |
| Capacity attributes | Records weight, cube, parcel count, pallet positions, or other relevant capacity measures. |
Operator Status Capture
Operator status capture is essential when telematics data alone cannot explain work context. Drivers, dispatchers, or mobile workflows should record state changes such as arrival at depot, loading started, route started, customer arrival, unloading complete, break, idle, return to depot, maintenance, and out of service.
Utilization Status Codes
Standardised status codes help avoid ambiguity. Common examples include:
- Available
- Assigned
- Loading
- Driving loaded
- Driving empty
- Unloading
- Waiting
- Idle
- Break
- Maintenance
- Out of service
The goal is not to create excessive administration; it is to ensure every hour and mile can be interpreted correctly.
Data Quality Issues That Distort Utilization
Even advanced analytics will underperform if the underlying data is incomplete or inconsistent. Watch for:
- Missing status updates that leave vehicles in the wrong state.
- Inconsistent shift calendars across depots or regions.
- Denominator drift, where the definition of “available capacity” changes over time.
- Duplicate asset IDs or vehicles assigned to the wrong class.
- GPS gaps that hide dwell time, route deviations, or unplanned stops.
- Manual overrides without reason codes.
- Contractor or 3PL fleet data that is reported at a different granularity from owned fleet data.
Strong data governance ensures utilization changes reflect real operational improvement, not measurement noise.
1. Vehicle Utilization Rate
This metric shows how often vehicles are on the road compared to how often they sit idle. If some vehicles rarely move or spend excessive time at loading bays, they should be reassigned or scheduled more effectively.
- Track average miles driven per day per vehicle
- Monitor long loading or waiting times that reduce productive hours
2. Revenue and Cost per Truck
This reveals how much each vehicle earns versus how much it costs to operate. If a truck consistently costs more than it generates, it signals the need to adjust routes, review maintenance schedules, or consider vehicle retirement.
3. Mileage and Empty Miles
Mileage data reveals how efficiently vehicles cover ground. Empty return trips—known as deadhead miles—waste both time and fuel.
- Combine delivery and pickup routes to eliminate non-revenue trips
- Use route optimization tools to cut wasted distance
4. Drop Density
Drop density is the number of drops per driver or per route on a particular day. With high drop density, fleet managers reduce the number of vehicles deployed while improving per-route performance.
5. Time Utilization
Time utilization is among the most critical metrics in any logistics scenario. It encompasses:
- Time spent on the road (productive driving hours)
- Pre-loading and awaiting departure time
- Idle time between stops
- Loading and unloading time at customer locations
- Delayed delivery time
Turnaround time is a critical driver of time utilization. Delays at depots, loading docks, customer unloading points, return-to-base processes, and route completion checkpoints all reduce productive vehicle hours. Tracking turnaround time by site, shift, customer, and vehicle class helps identify whether low utilization is caused by dispatch planning, dock capacity, warehouse readiness, or customer-side delays.
6. Fuel Consumption
Fuel consumption provides an essential supplementary view alongside miles traveled. It helps businesses minimize excessive fuel usage, thereby reducing fuel costs and identifying driver behavior issues.
7. Job History
After establishing all essential metrics, analyzing job history enables fleet managers to spot improvement areas over time. This analysis reveals:
- Driver performance patterns and routing inefficiencies
- Bottlenecks in delivery schedules
- Gaps between planned routes and actual execution
The only reliable way to assess the original plan against resulting performance is through job history analysis. With control tower software, managers can monitor these KPIs live and make quick, data-backed decisions to improve fleet productivity.
How To Improve Fleet Utilization?

Managing and improving fleet utilization is a complex undertaking. A wide range of constraints—customer-preferred time windows, route complexities, driver availability, vehicle types, and costs—must be balanced simultaneously. The following strategies provide a structured approach.
Focus on Crucial Fleet Utilization Metrics
Begin with the data. Fleet utilization metrics—detailed in the section above—reveal where inefficiencies hide. Prioritize:
- Miles Traveled: Traveling fewer miles reduces trip count and optimizes fuel consumption.
- Fuel Consumption: Supplements mileage data with cost-efficiency insights.
- Time Utilization: Breaks down every hour a vehicle spends on the road, at a dock, or sitting idle.
- After-Hours Utilization: Can bypass congestion issues, though environmental and noise regulations must be evaluated per location.
- Empty Running / Vehicle Fill: CEP companies focus on reducing empty journey legs and maximizing average weight utilization. Minimizing loading and unloading time is essential to improving this metric.
- Drop Density: Higher drops per route means fewer vehicles needed and better per-route performance.
- Job History: Identifies patterns, bottlenecks, and the gap between planned and actual delivery execution.
How to Diagnose Low Fleet Utilization
Low fleet utilization is a symptom, not a root cause. Diagnose it by separating demand, downtime, and visibility issues.
| Diagnosis Area | What to Check | Likely Signal |
| Demand problem | Order volume, route density, delivery windows, seasonality, customer cancellations | Vehicles are available, but there is not enough profitable work to assign. |
| Downtime problem | Breakdown frequency, maintenance backlog, preventive maintenance compliance, parts delays | Demand exists, but vehicles cannot be deployed reliably. |
| Visibility problem | Missing status updates, delayed GPS pings, manual dispatch exceptions, untracked contractor capacity | Vehicles appear unavailable or idle because the system lacks accurate real-time status. |
| Planning problem | Poor route sequencing, mismatched vehicle class, long dwell time, avoidable empty miles | Demand exists and vehicles are available, but dispatch decisions reduce productive output. |
This root-cause view prevents the wrong response. If demand is low, adding vehicles will worsen utilization. If downtime is high, better routing alone will not solve the problem. If visibility is poor, the operation may already have enough capacity but cannot allocate it intelligently.
Use Alerts to Flag Underused and Overused Assets
Automated alerts help fleet teams act before underutilization becomes structural or overutilization creates reliability risk. Useful alert types include:
- Vehicles below minimum productive hours for a defined number of shifts.
- Vehicles with high idle time or repeated depot dwell.
- Assets exceeding mileage or hour thresholds without scheduled maintenance.
- Routes with recurring empty miles above the agreed tolerance.
- Vehicle classes consistently operating below load or cube thresholds.
- Depots with abnormal differences between planned and actual utilization.
Alerts should be paired with reason codes so teams can distinguish between valid exceptions and repeatable process failures.
Why Very High Utilization Can Create Risk
Very high utilization can look efficient in a dashboard while reducing operational resilience. When every vehicle is fully committed, the fleet has limited ability to absorb breakdowns, urgent orders, traffic disruption, weather events, driver absence, or customer rescheduling.
The risk is especially high in last-mile operations where delivery windows are narrow and customer expectations are unforgiving. The goal is not to push every asset to 100%; it is to maximise productive work while preserving enough buffer to maintain service levels and protect the asset base.
Balance Utilization With Maintenance and Safety
Utilization gains should be balanced against maintenance and safety indicators. A fleet that improves utilization by deferring maintenance is not becoming more efficient; it is transferring cost and risk into the future.
Track these guardrail metrics alongside utilization:
| Guardrail Metric | Why It Matters |
| Preventive maintenance compliance | Confirms vehicles are receiving scheduled maintenance before reliability deteriorating. |
| Maintenance backlog | Shows whether assets are being used faster than the maintenance function can service them. |
| Inspection failures | Highlights emerging reliability or compliance problems. |
| Safety leading indicators | Includes harsh braking, speeding, fatigue signals, near-miss trends, and repeated driver behaviour exceptions. |
| Unplanned downtime | Reveals whether higher utilization is increasing breakdown risk. |
A mature fleet utilization programme improves productivity without compromising uptime, safety, or asset life.
Select the Right Vehicle Size
There is no one-size-fits-all fleet configuration that suits ever-changing customer demands. Finding the right vehicle size for effective fleet operations depends on:
- Availability of different-sized vehicles in the fleet
- Customized fleet requirements per route or customer segment
- Identifying and correcting under-utilization of vehicle deck space
- Matching vehicle capacity to actual delivery volumes
- Optimal deployment of extra or overflow vehicles
Optimize Loading and Unloading
Every delivery must count. Reducing under-utilized space requires planning deliveries by load shape, volume, and height. Equally important is balancing the time drivers spend loading and unloading with their available driving hours.
When drivers wait extended periods to unload and load packages, they lose productive driving time. This directly reduces the number of orders delivered per day and increases per-order cost.
Address Last-Minute Re-Routing Challenges
The biggest challenge for delivery operations is managing last-minute changes caused by traffic, roadblocks, accidents, vehicle breakdowns, or customer rescheduling. A dynamic route optimization process is essential to accommodate these changes without cascading into missed or failed deliveries. The Locus Dispatcher solution addresses these challenges by re-optimizing routes in real time.
In 2026, the efficiency of a fleet depends heavily on how effectively an organization manages last-minute routing challenges. With 61% of fleet managers rating delivery at a specific time and place (DIFOT) as highly important, the ability to dynamically reroute while maintaining delivery windows is a competitive differentiator.minute routing challenges.
How can technology improve fleet utilization?

Being a CEP business, if your fleet operations aren’t contributing to profitability, it needs to be worked upon. Especially, if your If fleet operations are not contributing to profitability—whether due to high vehicle downtime, traffic congestion, excessive fuel consumption, or poor on-time delivery rates—technology intervention is no longer optional. With 95% of fleets already using vehicle tracking software and average accident cost savings from fleet technology doubling to 22%, the question is not whether to invest in technology but how to maximize its return.
Here is how last-mile delivery software improves fleet capacity utilization.
1. Provides Actionable Fleet Utilization Metrics
Fleet managers are under constant pressure to manage efficiency levels. With high competition in delivery services and rising operational costs, tracking inefficiencies is non-negotiable. Fleet utilization metrics answer three critical questions:
- Are we currently making the best use of the fleet?
- How well are we utilizing available capacity?
- How can we improve fleet capacity utilization?
Without these answers, it is impossible to create targeted plans and make objective decisions for improved fleet performance. Fleet utilization metrics in last-mile delivery span cost-efficiency, customer service, and productivity.
For example, if delivery costs are rising due to high fuel consumption or reduced mileage, fleet management software identifies the exact quantity of fuel excessively consumed and the specific vehicles delivering lower mileage than expected. By investing in advanced analytical capabilities, organizations can track, identify, and solve for inefficiencies that lead to under-utilized fleets.
2. Makes Deliveries Sustainable
Sustainable delivery has shifted from a nice-to-have to a business imperative. A study found that 44% of consumers are more likely to buy from a brand with a clear commitment to sustainability. North America stands as the second highest emitter of carbon emissions in last-mile delivery at 5 million tonnes of CO? released annually.
Delivery management software creates optimal clusters of deliveries based on delivery zones, fleet capacity, and time windows. It ensures vehicles do not overlap and maximizes deliveries while traveling less distance. This results in higher drop density, optimal load capacity, and usage of fewer vehicles—thereby minimizing empty miles.
Additionally, 35% of EV fleets have improved efficiency and daily operations management with fleet software, demonstrating how technology accelerates sustainability goals alongside utilization improvements.
With delivery management software, businesses can plan forward and reverse logistics deliveries effectively. The system automatically batches deliveries for backward and forward shipments in the same service areas together, reducing distance traveled per order and improving fleet utilization.
3. Helps Deliver Orders at Customer’s Preferred Time
What happens when a business does not provide multiple delivery time slots to customers? Either a failed delivery attempt occurs or the customer defects. Every failed delivery attempt multiplies costs and minimizes efficiency.
By enabling Delivery Linked Checkout, businesses provide customers multiple time slots for order delivery. This feature optimizes fleet capacity and costs, enabling delivery at greater speeds while creating predictable, customized delivery experiences that boost operational efficiency.
Delivery linked checkout drives faster, more flexible deliveries and friction-free post-purchase experiences. It improves First Attempt Delivery Rates (FADR), minimizes cart abandonment, and secures profitability without compromising customer experience.
4. Optimal Delivery Routes + Improved Load Balancing = High Fleet Capacity Utilization
Fleet capacity utilization requires simultaneous management of capacity, time schedules, routes, and costs—a challenge that is nearly impossible without technology at scale.
By using dispatch management software, organizations can simultaneously manage loads and routes for their fleet. Unlike legacy TMS systems, Locus’s advanced AI algorithms optimize delivery routes and fleet capacity across 250+ real-world business constraints—including different customer-preferred time slots, vehicle types, driver skills, and zone restrictions. This minimizes the distance traveled by the fleet and reduces the number of vehicles used, directly improving fleet capacity utilization.
Understanding why your business needs route optimization is foundational to unlocking these combined benefits of load balancing and route efficiency.
Benefits of Optimizing Fleet Utilization
Improving fleet utilization delivers compounding benefits across operations, finance, and customer experience. Here are the measurable advantages:
Cost Reduction and Higher ROI
Eliminating idle vehicles, reducing deadhead miles, and right-sizing the fleet directly lower operating costs. 47% of GPS fleet tracking users realized positive ROI in less than a year, and organizations that improve utilization by just 10–20% see significant profitability gains.
Improved On-Time Delivery Performance
Higher fleet utilization—when achieved through better routing and load optimization rather than simply running vehicles harder—correlates directly with improved on-time delivery rates. With 61% of fleets rating DIFOT as highly important, this is a critical competitive metric.
Enhanced Sustainability and Lower Emissions
Fewer vehicles running more efficient routes means reduced fuel consumption and lower carbon emissions. Optimized fleet utilization supports corporate sustainability goals while simultaneously reducing costs.
Better Asset Lifecycle Management
Understanding how each vehicle is used—hours, mileage, load stress—enables predictive maintenance scheduling and smarter replacement cycles. 73% of fleets prioritize vehicle ordering and replacement, and utilization data is the foundation for these decisions.
Scalability Without Proportional Fleet Growth
When existing fleet assets are maximized, organizations can handle demand growth without proportional increases in fleet size—preserving capital and reducing complexity.
Why Choose Locus for Fleet Utilization
Unlike traditional TMS or manual planning approaches, Locus leverages AI to optimize routes across 250+ real-world constraints, delivering measurable cost and efficiency gains. Here is how Locus differentiates:
| Capability | Legacy / Manual Solutions | Locus AI-Driven Platform |
| Route Optimization | Static and rule-based routing with limited adaptability. | Dynamic AI-powered optimization across 250+ operational constraints. |
| Load Balancing | Manual assignment processes that are time-consuming and error-prone. | Automated load-to-vehicle matching based on capacity, time windows, and geographic zones. |
| Real-Time Adjustments | Requires continuous dispatcher intervention for operational changes. | Autonomous re-routing using live traffic and constraint data. |
| Fleet Analytics | Spreadsheet-based reporting with delayed operational visibility. | Real-time dashboards delivering actionable utilization and performance insights. |
| Planning Speed | Hours of manual route and fleet planning work. | Up to 66% faster planning cycles through AI-driven automation. |
| Integration | Siloed operational systems with fragmented workflows. | Unified connectivity across TMS, OMS, ERP, and related logistics systems. |
Enterprise customers report up to 20% reduction in fleet costs and significant improvements in on-time delivery performance. Locus’s fleet management software—trusted by 360+ leading enterprises worldwide—provides advanced analytical insights on essential fleet utilization metrics that help track performance, identify inefficiencies, and drive operational excellence.
Based on specific business constraints—vehicle types, delivery windows, driver availability, zone restrictions, and load characteristics—Locus automates load assignment tasks, maximizes on-ground fleet performance, and enables data-driven strategies for continuous improvement.
Fleet capacity utilization: The key to improving your profitability
Achieving 100% fleet utilization is neither realistic nor operationally desirable—vehicles need maintenance windows, and demand naturally fluctuates. However, targeting the 70–85% benchmark through time-, distance-, and capacity-based optimization delivers transformative results. Improving fleet utilization by even 10–20% directly reflects in a business’s profitability.
The path forward requires:
- Leveraging analytical insights from fleet utilization metrics to right-size the fleet and eliminate waste.
- Investing in telematics and AI to reduce deadhead miles and downtime, driving 15%+ efficiency gains through real-time visibility.
- Proactive right-sizing through utilization studies that prevent over-fleeting or under-fleeting, aligning supply with demand.
- Adjusting utilization targets for seasonality so peak, off-peak, holiday, and promotional demand patterns are not measured against a single static benchmark.
- Holistic measurement across time, distance, and capacity to ensure improvements in one dimension do not create inefficiencies in another.
Adjusting Utilization for Seasonality
Seasonality can make utilization look artificially strong or weak if reporting uses a flat annual benchmark. Peak periods, off-peak weeks, holiday surges, promotional campaigns, payday cycles, weather events, and regional demand shifts can all change the amount of fleet capacity required.
A practical model separates:
- Baseload capacity: the recurring fleet capacity required to cover predictable demand.
- Surge capacity: additional flexible capacity preserved for demand spikes, promotional events, peak seasons, or service recovery.
- Seasonal benchmarks: utilisation targets that differ by peak, shoulder, and off-peak periods.
This prevents fleets from overcorrecting after quiet periods or underinvesting before predictable peaks. In high-service last-mile environments, intentionally preserving surge capacity can be the difference between profitable growth and missed delivery promises.
High utilization boosts revenue, supports sustainability (lower emissions), and improves customer satisfaction through reliable, on-time delivery operations. For logistics leaders in 2026, fleet utilization is not merely an operational metric—it is a strategic lever for competitive advantage.
Locus’s fleet management software provides the advanced analytical insights, automated dispatch, and real-time optimization capabilities needed to turn fleet utilization data into measurable profitability gains.
Frequently Asked Questions (FAQs)
What is fleet utilization and why is it important?
Fleet utilization measures the percentage of available time, distance, or capacity that vehicles spend on productive work, excluding idle time and maintenance. It is crucial because maximizing fleet utilization ensures optimal usage of vehicles, manages delivery costs effectively, and helps determine the right fleet size for operations. A well-utilized fleet improves productivity, reduces costs, and directly boosts profitability. Industry benchmarks indicate that a healthy fleet operates at approximately 70% utilization, with high-performing operations targeting 75–85%.
How do you calculate fleet utilization?
Fleet utilization can be calculated using three approaches. Time-based: (Total Productive Hours ÷ Total Available Hours) × 100. Distance-based: (Total Loaded Miles ÷ Total Miles Driven) × 100. Capacity-based: (Actual Load Carried ÷ Rated Vehicle Capacity) × 100. Most logistics teams combine all three for a comprehensive view. For example, a fleet may show 80% utilization by vehicle count, but if half those vehicles run under capacity, true efficiency may be closer to 60–65%.
What is a good fleet utilization rate?
A healthy fleet utilization rate is approximately 70%, which balances productivity with necessary downtime for maintenance and repairs. Trucking and CEP operations with advanced telematics and AI-driven dispatch often target 75–85%. Construction fleets may average lower due to site wait times and project-based scheduling. The optimal rate depends on industry, vehicle type, and operational complexity.
What causes low fleet utilization?
Common causes include high vehicle downtime from unplanned repairs, poor route planning leading to excessive deadhead miles (empty, non-revenue trips), inadequate real-time visibility, inefficient dispatching, long loading and unloading times, and mismatched vehicle types for delivery requirements. Without telematics and analytics, these inefficiencies remain hidden and compound over time.
What are the key metrics for improving fleet utilization?
Essential metrics include vehicle utilization rate, revenue and cost per truck, mileage and empty miles, drop density per route, time utilization (driving, loading, idle, delay breakdown), fuel consumption per delivery, and job history data. Analyzing these metrics reveals inefficiencies, informs optimization decisions, and enables continuous performance improvement.
How can selecting the right vehicle size help maximize fleet utilization?
Matching vehicle capacity to actual delivery requirements is critical. Factors include the range of vehicle sizes available, customized fleet needs per route or customer segment, avoiding underutilized vehicle deck space, aligning vehicle capacity with actual delivery volumes, and optimal deployment of overflow vehicles. Proper vehicle sizing ensures deliveries are made efficiently without wasted capacity.
What are the challenges in managing last-minute routing changes for fleet utilization?
Last-minute changes caused by traffic disruptions, roadblocks, vehicle breakdowns, or customer rescheduling are among the most significant operational challenges. These require dynamic route re-optimization to avoid missed or failed deliveries. With 61% of fleet managers rating on-time, on-location delivery as highly important, the ability to dynamically reroute while maintaining delivery windows is essential for maintaining high fleet utilization.
How does fleet utilization support sustainability goals?
Optimized fleet utilization directly reduces fuel consumption and carbon emissions by ensuring fewer vehicles travel shorter, more efficient routes with fuller loads. Fewer deadhead miles mean less wasted fuel. Consolidated deliveries reduce the total number of vehicles on the road. Organizations investing in fleet technology are achieving average fuel savings of 16%, which translates directly into lower emissions.
How can Locus’s solutions help improve fleet utilization?
Locus’s fleet management software provides advanced AI-driven analytics on essential fleet utilization metrics spanning cost-efficiency, customer service, and productivity. Unlike legacy systems, Locus optimizes across 250+ real-world constraints—including vehicle types, delivery windows, driver skills, and load characteristics. Key capabilities include real-time analytics dashboards, automated load-to-vehicle assignment, dynamic route optimization, and delivery linked checkout for customer time-slot booking. Enterprise customers report up to 20% reduction in fleet costs and significantly faster planning cycles.
What ROI can fleet technology deliver for utilization improvements?
47% of GPS fleet tracking users realized positive ROI in less than a year. Average fuel savings from fleet technology have doubled to 16%, and accident cost savings have reached 22%. Organizations that improve fleet utilization by 10–20% through technology see the impact reflected directly in profitability, with reduced vehicle requirements, lower fuel costs, and improved customer delivery performance.
What is the difference between fleet utilization, availability, and uptime?
Fleet utilization measures how much available time, distance, or capacity is converted into productive work. Availability measures whether a vehicle is ready to be assigned. Uptime measures whether the vehicle is mechanically or technically operational. A vehicle can have high uptime and be available, but still have low utilization if it is not assigned to productive work.
Should planned maintenance count against fleet utilization?
Planned maintenance should be tracked, but it should be separated from avoidable idle time. Many fleets report both gross utilization, which includes all capacity, and net operational utilization, which excludes approved maintenance and compliance downtime. This prevents maintenance discipline from being mistaken for poor dispatch performance.
Can fleet utilization be too high?
Yes. Very high utilization can reduce resilience if every vehicle is fully committed and there is no buffer for breakdowns, urgent orders, traffic disruption, weather, maintenance, or driver absence. The objective is to maximise productive work while maintaining enough spare capacity to protect service levels, safety, and asset reliability.


Last Mile Delivery Optimization
Hyperlocal Delivery: What It Is and How Does It Work?

May 31, 2025
Explore how hyperlocal delivery management software enables retailers and logistics providers to cut costs, boost speed, and improve customer experience.
Read more
Featured
Hub and Spoke Distribution Model: A Logistics Guide

May 31, 2025
Key Takeaways In an environment where every customer matters, know how a hub and spoke model can satisfy consumers with faster deliveries. What is the Hub and Spoke Distribution Model? As the name suggests, a hub and spoke model is a centralized warehousing and shipment system that resembles the structure of a bicycle wheel. The […]
Read moreInsights Worth Your Time




















What Is Fleet Utilization? Key Metrics & Importance in 2026