


General
The Predictive Analytics Gap in European Supply Chain Dashboards: Why Visibility Without Forecasting Fails in 2026

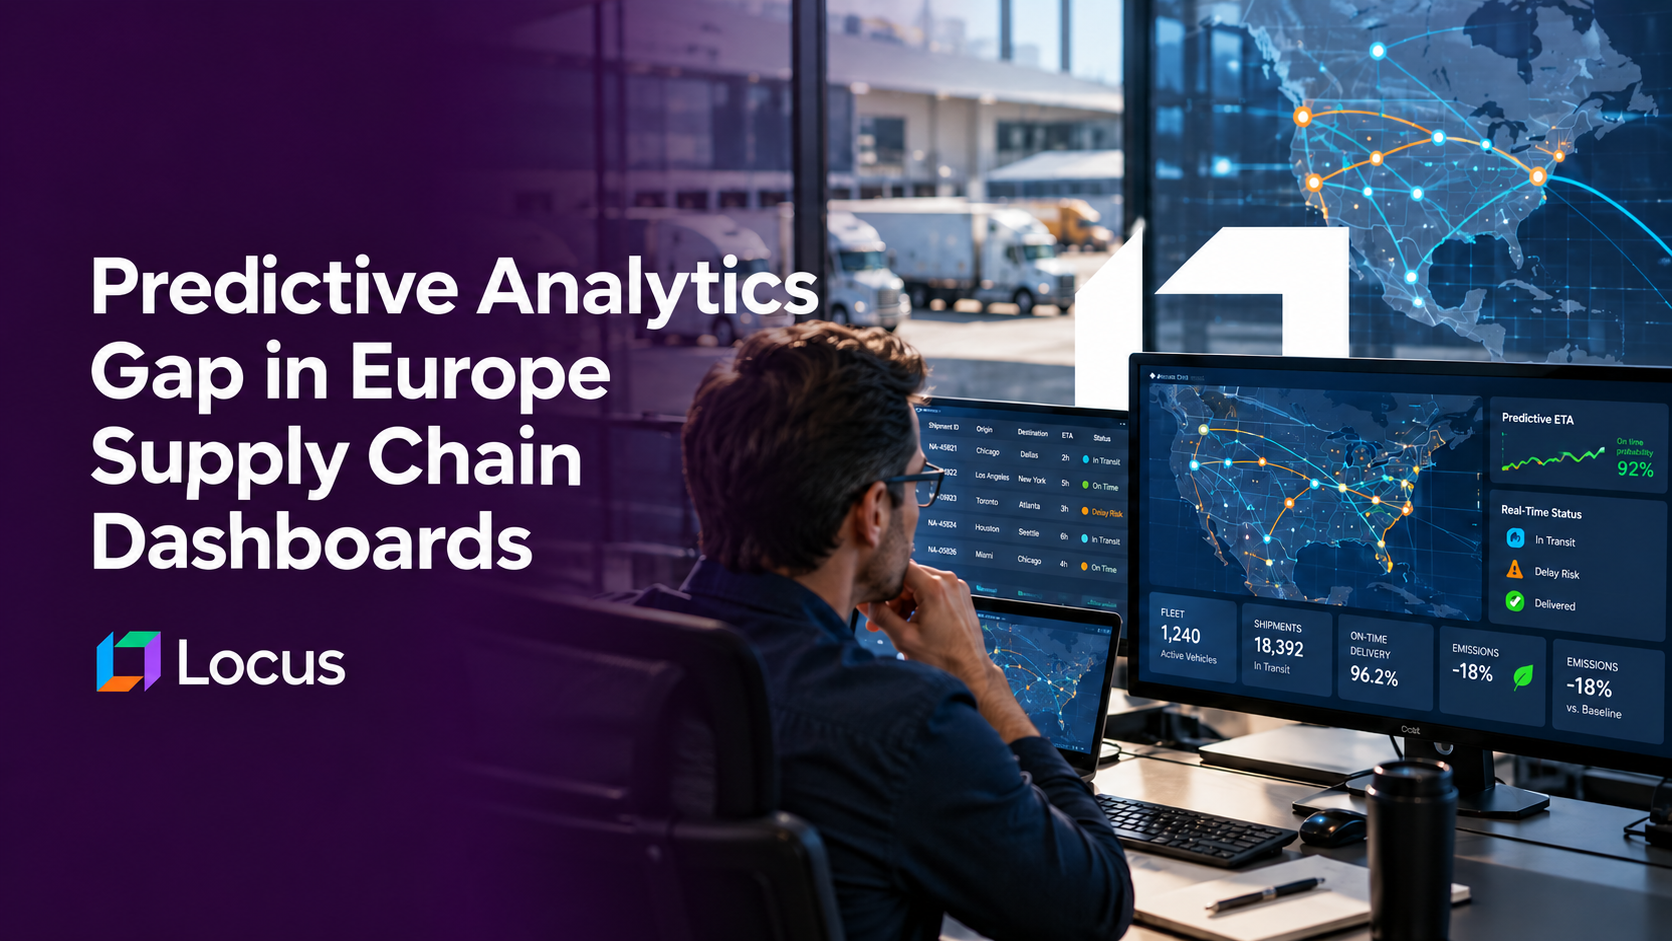
A predictive analytics gap is the difference between a dashboard that reports what has already happened in a supply chain and one that forecasts what is about to happen with enough lead time to act on it. Most European supply chain dashboards in 2026 are built for the first job: they consolidate shipment, inventory and carrier data into one screen, but the underlying model is descriptive, not predictive, so a disruption still surfaces as a red flag after it has already cost lead time. Locus, the world’s first agentic Transportation Management System, treats this gap as the core design problem, building forecasting into the dashboard layer rather than bolting prediction on top of a reporting tool.
Key Takeaways
- A predictive analytics gap means a dashboard shows current and historical state accurately but cannot forecast disruption far enough ahead for a planner to act.
- AI-enabled supply chain forecasting correlates with 65% better service levels, 35% lower inventory and 15% lower logistics costs than slower-moving competitors, per McKinsey.
- Europe’s supply chain visibility software market reached $900 million in 2025 at a 12.8% CAGR, yet most spend sits in reporting tools, not forecasting layers.
- Forecasting is cited as a top challenge by 44% of supply chain leaders, more than any single technology gap, per the 2025 MHI Annual Industry Report.
- Locus’s Orchestrator and Capacity agents run continuous forecasting against live network data, not a static plan refreshed weekly, closing the gap between what a dashboard shows and what it predicts.
- A Fortune 50 parcel network uncovered more than $14 million in capacity it already owned once its dashboard began forecasting demand against live constraints rather than reporting a fixed plan.
Why the Predictive Analytics Gap Matters: The Business Case
Organizations that successfully implement AI-enabled supply chain management see service levels improve by 65%, inventory levels fall by 35% and logistics costs drop by 15% compared with slower-moving competitors, according to McKinsey’s research on AI in the supply chain. The gains come specifically from shifting the underlying model from reactive tracking to predictive forecasting, not from consolidating more data onto a single screen.
Europe’s supply chain visibility software market alone reached roughly $900 million in 2025 and is growing at a 12.8% compound annual rate, according to Global Market Insights, with Europe accounting for close to 29% of global visibility software revenue. That spend is overwhelmingly directed at consolidating and displaying shipment, carrier and inventory data, the descriptive half of the problem. Forecasting is a separate capability, and it is the one supply chain leaders say they are missing most: the 2025 MHI Annual Industry Report found forecasting cited as a top challenge by 44% of supply chain leaders, ahead of several technology-specific concerns in the same survey.
The distinction matters most in Europe specifically because of the region’s structural fragmentation: cross-border freight moves through multiple customs regimes, carrier networks and regulatory jurisdictions, each a separate place where a descriptive dashboard can show a delay only after it has already happened. A predictive layer running against the same data has to forecast the delay before the shipment reaches that jurisdiction, which is a materially different modeling problem than displaying current state across borders.
How a Predictive Analytics Layer Closes the Dashboard Gap
1. Separate the Reporting Model From the Forecasting Model
A dashboard’s reporting layer answers “where is it now and what already happened.” A forecasting layer answers “what is likely to happen and when.” These require different underlying models, and the first step in closing the gap is building both rather than assuming more reporting granularity eventually becomes prediction.
2. Train the Forecasting Model on Live Network Data, Not a Static Plan
A demand or disruption forecast refreshed weekly or monthly is already stale by the time a planner acts on it. The forecasting layer needs to retrain continuously against live shipment, carrier capacity and exception data, not run against a plan set at the start of a quarter.
3. Rank Forecasted Risks by Operational Impact, Not Just Probability
Not every forecasted delay matters equally. A system that surfaces every statistically likely disruption without ranking by downstream cost or SLA exposure recreates the same noise problem as a purely descriptive dashboard, just earlier in the timeline.
4. Attach a Recommended Action to Every High-Impact Forecast
A forecast without a recommended response is still just information. The system should pair each high-impact forecasted risk with a specific recommended action: re-route, re-prioritize a carrier, or reallocate capacity ahead of the disruption reaching the network.
5. Validate Forecast Accuracy Against Realized Outcomes Continuously
Every forecast needs to be checked against what actually happened, continuously, not audited once a quarter. This is what keeps the model trustworthy enough for a planner to act on its recommendation without re-verifying it manually.
6. Feed Realized Outcomes Back Into the Model
Forecast accuracy compounds only if realized outcomes retrain the model. A static model that does not learn from its own forecasting misses stays only as good as the data it launched with.
| Also Read: The Control Tower Test: 7 Signals Your Supply Chain Visibility Stack isn’t Working in 2026 |
|---|
Descriptive Dashboards vs Predictive Dashboards: Key Differences
| Dimension | Descriptive Dashboard | Predictive Dashboard |
|---|---|---|
| Core question answered | Where is it now, what already happened | What is likely to happen, and when |
| Data refresh model | Often batch or periodic | Continuous, retrained against live data |
| Response to cross-border disruption | Surfaces the delay after it reaches that jurisdiction | Forecasts risk before the shipment reaches it |
| Output to the planner | A status view | A ranked, actionable forecast |
| Learning loop | None, or manual review | Realized outcomes retrain the model |
| Typical European deployment | Shipment and carrier tracking consolidated to one screen | Forecasting layer built on top of or replacing the tracking layer |
What to Look for in a Predictive Supply Chain Analytics Platform
A genuinely separate forecasting model, not relabeled reporting. Ask whether the platform’s “predictive” feature is a distinct trained model or simply a dashboard that extrapolates a trend line from historical data.
Continuous retraining against live network data. A forecasting layer that updates weekly cannot keep pace with daily cross-border disruption. It needs to retrain against live shipment and exception data.
Impact-ranked forecasts, not raw probability lists. The platform should rank forecasted risks by downstream operational and SLA impact, not simply by statistical likelihood.
A recommended action attached to each high-impact forecast. A forecast is only useful if it comes with a specific next step the planner can execute or approve.
A visible accuracy track record. Ask the vendor to show forecast accuracy against realized outcomes over time, not just a description of the model’s methodology.
The Predictive Analytics Gap Closed in Practice
A Fortune 50 parcel network running a 120-country operation moved from a weekly plan execution rate of 75% to 92% once its dashboard began forecasting capacity and demand against live network constraints rather than reporting a fixed plan, uncovering more than $14 million in capacity it already owned but could not see coming.
A leading North American retailer consolidated six legacy systems and moved from a reactive, status-only view to a forecasting-driven one, resolving exceptions in under two hours and reaching 99%+ on-time delivery, a direct result of forecasting disruption early enough to act rather than discovering it after the fact.
Common Mistakes European Supply Chains Make With Predictive Analytics
Treating more dashboard granularity as a substitute for forecasting. Adding more data fields to a reporting screen does not create a forecasting capability. The two are separate models solving separate problems.
Refreshing the forecast on a planning cadence, not an operational one. A model retrained monthly cannot forecast a customs delay or carrier disruption that develops over days.
Surfacing every statistical risk without ranking impact. An unranked list of forecasted disruptions recreates alert fatigue earlier in the timeline instead of eliminating it.
Never validating forecast accuracy against what actually happened. Without a continuous accuracy check, a forecasting layer can quietly degrade and nobody notices until a disruption it should have caught goes unflagged.
How Locus Approaches the Predictive Analytics Gap
Locus, the world’s first Decision-Intelligent, Agentic TMS, is recognized by Gartner for seven consecutive years, featured in the 2026 Hype Cycle for Supply Chain Execution and Logistics Technologies, named a Leader in TMS by QKS Group’s SPARK Matrix, and ranked #1 in Route Planning on G2’s 2026 Best Software Awards. In October 2025, Ingka Investments, the investment arm of Ingka Group, the world’s largest IKEA retailer, acquired Locus. Locus continues to operate independently.
Locus’s Orchestrator and Capacity agents run forecasting as a continuous process against live shipment, carrier and exception data rather than a periodic planning exercise, so the dashboard a European logistics team sees is already ranking forecasted risk by operational impact and attaching a recommended action, not just displaying where a shipment is right now. This is the architectural difference between a control tower and a reporting dashboard: a control tower anticipates and ranks, a dashboard displays. The Fortune 50 parcel network case shows this forecasting layer uncovering $14 million in capacity a purely descriptive dashboard never would have surfaced, and the North American retailer case shows the same forecasting-first approach cutting exception resolution time to under two hours. Schedule a Locus demo to see how a forecasting-first dashboard handles your network’s cross-border risk.
The predictive analytics gap in European supply chain dashboards is not a data problem, since most platforms already consolidate enough shipment and carrier data onto one screen. It is a modeling problem: descriptive tracking and predictive forecasting are different capabilities, and visibility without the second one still leaves a planner reacting to disruption after it has already cost lead time, which is the gap Locus’s agentic architecture is built to close.
Frequently Asked Questions
What is the predictive analytics gap in supply chain dashboards? It is the difference between a dashboard that accurately reports current and historical shipment, inventory and carrier state, and one that forecasts likely disruption far enough ahead for a planner to act before it happens. Most dashboards solve the first problem well and the second one poorly or not at all.
Why is this gap more acute in Europe specifically? European freight routinely crosses multiple customs regimes, carrier networks and regulatory jurisdictions, each a point where a descriptive dashboard can only show a delay after it has already occurred in that jurisdiction. A forecasting layer has to predict the delay before the shipment reaches it, which is a harder and more valuable capability in a fragmented, cross-border network.
Does adding more data to a dashboard eventually create forecasting capability? No. Reporting and forecasting are different models solving different problems. More granular historical data improves what a dashboard can display about the past, but it does not on its own predict what is likely to happen next without a separately trained forecasting model.
What makes a supply chain forecast trustworthy enough to act on? A visible, continuously updated accuracy track record against realized outcomes, impact ranking rather than raw probability lists, and a recommended action attached to each high-impact forecast rather than a bare risk notification.
How much business impact does closing the predictive analytics gap deliver? McKinsey’s research found organizations that successfully implement AI-enabled supply chain forecasting see service levels improve by 65%, inventory levels fall by 35%, and logistics costs drop by 15% compared with slower-moving competitors.
What is the difference between a control tower and a predictive dashboard? A reporting dashboard displays where shipments are and what has already happened. A control tower, which is what a predictive dashboard should function as, anticipates disruption, ranks it by operational impact, and recommends an action, reconciling a fragmented network into a single forward-looking view rather than a historical one.


General
The Order-to-Rider Allocation Problem in North American Holiday Surge 2026: A Decision-by-Decision Autonomy Framework

Oct 1, 2026
Why North American holiday surge breaks single-mode dispatch, and how a decision-by-decision autonomy framework assigns each order-to-rider decision to the right level of automation.
Read more
General
The Delivery Trust Gap in North America: Why CSAT Drops on Deliveries That Arrive On Time in 2026

Oct 1, 2026
On-time delivery rate and delivery CSAT measure different things. Why North American retailers see satisfaction drop even on deliveries that arrive within the promised window.
Read moreInsights Worth Your Time


















The Predictive Analytics Gap in European Supply Chain Dashboards: Why Visibility Without Forecasting Fails in 2026