


General
European EV Fleet Payback: Range or Density? What Decides the ROI of Electric Vans in 2026

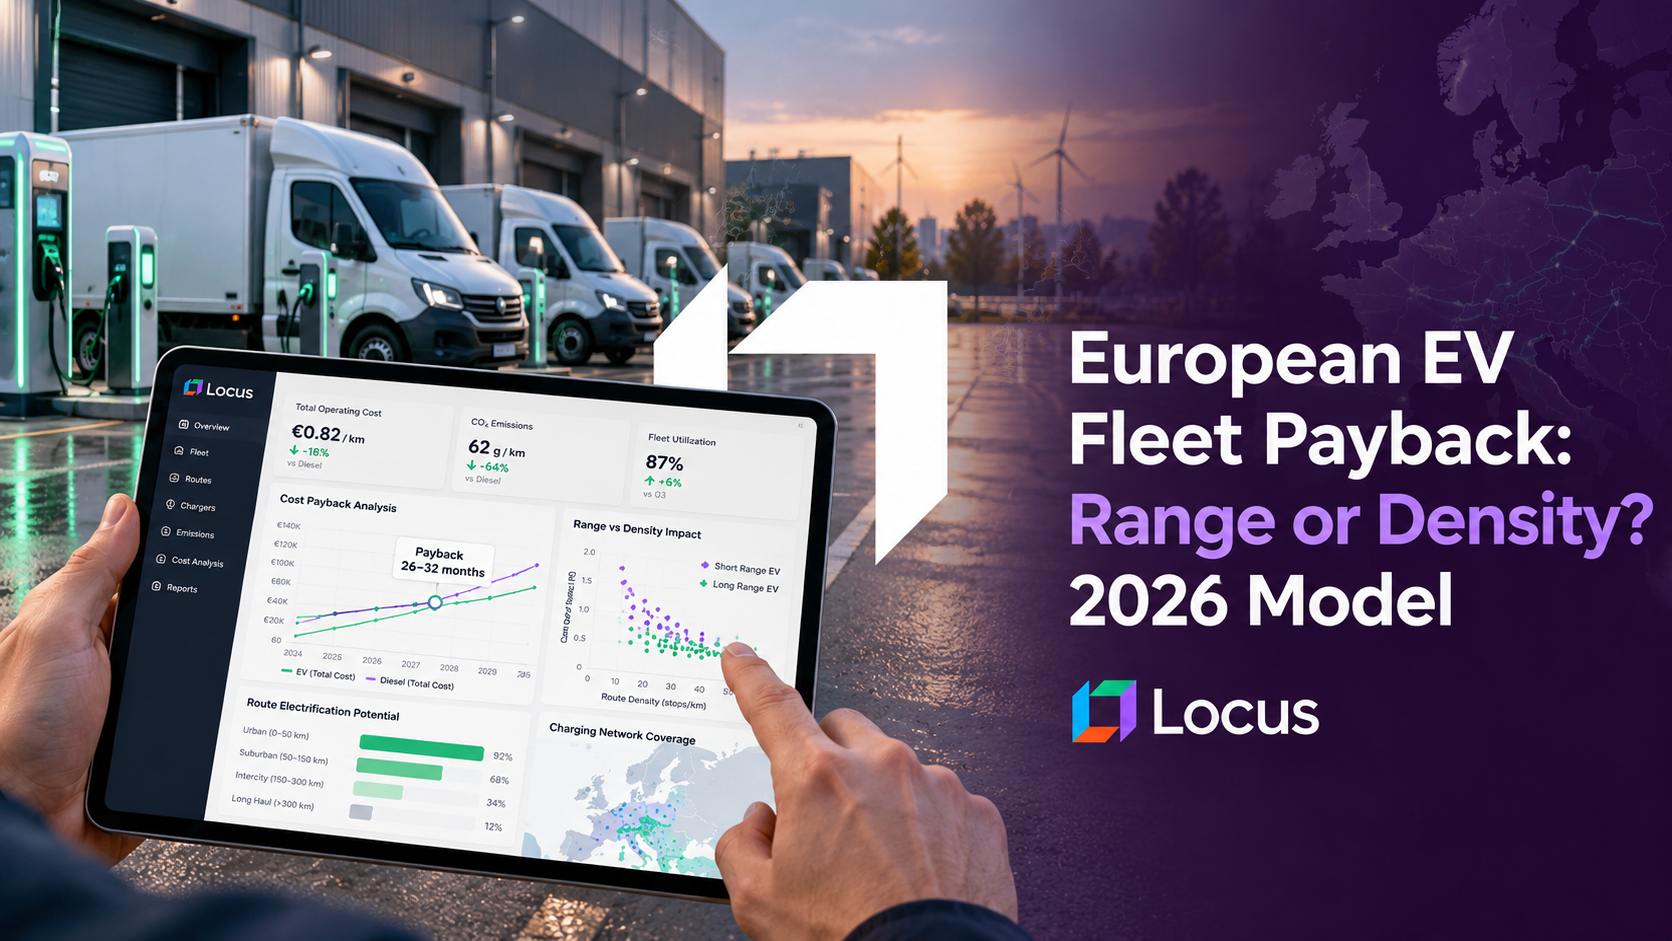
European EV fleet payback is the time an electric van’s energy and maintenance savings take to repay its purchase premium over a comparable diesel van, and it is set by how far the van runs each day, not by battery range or the specification sheet alone. Range sets the upper limit, because a route longer than usable range cannot be electrified. The repayment arithmetic sets a lower limit, because a route that is too short never earns the premium back. Route density decides where a route lands between the two. Locus, the world’s first Decision-Intelligent, Agentic TMS, matches vehicles to routes against that window.
Key Takeaways
- EV payback has a window: a floor set by the purchase premium and energy savings, and a ceiling set by usable range, not rated range.
- In the model below, with a €12,000 premium and diesel at €2.24 a litre, the floor is 59 km a day; before diesel rose 40% this year it was 86 km.
- Range is a gate: it changes nothing for routes inside the window and everything for routes beyond it.
- Density acts through daily distance: a very dense 50 km route loses about €360 per van-year, while a 90 km route gains about €1,270.
- Locus’s Capacity agent matches vehicles to routes against 250+ constraints including range, so electrification follows the window.
Why EV Payback Matters: The Business Case
The fuel side of the equation moved sharply this year. The EU average diesel price rose from €1.594 a litre on 23 February 2026 to €2.237 on 28 September, an increase of 40%, based on the European Commission’s Weekly Oil Bulletin.
The electricity side is steadier. The EU average price for medium-sized non-household consumers was €0.1837 per kWh in the second half of 2025, according to Eurostat.
The vehicle does not deliver its brochure range. Arval’s testing at Millbrook found that fleet operators should expect electric vans to reach 60 to 70% of their claimed range in real-world use, across three van sizes and three payloads in cold conditions. The testing dates from 2021, so treat the ratio as a planning floor.
Averages hide the route. A 2022 Transport & Environment study across six countries found the average EU electric van 25% cheaper to own and run than a diesel van, at €0.15 per km against €0.20, but an average per-km figure says nothing about whether a specific route runs enough kilometres to earn it.
Regulation adds a second driver. From 1 January 2025, new vans operating within Amsterdam’s S100 ring road must be emission-free, older vans have until 2030, and the city offers €3,000 towards an electric van until June 2028. Density is the other lever on cost: McKinsey puts the last mile at 60 to 70% of total parcel delivery cost and finds raising drops per stop from 1 to 5 cuts labour and vehicle cost by more than 50%.
How to Find Your EV Payback Window in Six Steps
1. Optimise first, then measure daily distance
Take the distribution of daily route kilometres after optimisation, including the stem distance to and from the depot. Optimisation shortens routes, so sizing an EV order on today’s unoptimised kilometres overstates the savings it will deliver.
2. Set usable range, not rated range
Discount the rated range for real-world conditions and payload, then hold a buffer. A van rated at 300 km at 60% of claimed range is a 180 km asset, and every route longer than that is outside the window regardless of density.
3. Compute the floor
Break-even daily distance equals the annual purchase premium divided by the saving per kilometre and the operating days. A route below that distance does not repay the premium on energy and maintenance savings alone. The model below shows how sharply the floor moves with the diesel price.
4. Sort routes into three bands
Routes below the floor stay diesel unless access rules intervene. Routes between the floor and usable range are the electrification candidates. Routes above usable range wait for a longer-range vehicle, a mid-route charge or a redesigned route.
5. Add access value as a separate line
Zero-emission zones can make an electric van mandatory for a route whatever its payback, as in Amsterdam. Price that access value on its own so it does not hide a route that fails on distance.
6. Sequence, then re-run
Electrify the in-window routes first and recompute when diesel, electricity or route density change. The fuel emissions removed feed the sustainability reporting your CSRD scope 3 data already needs.
The Sensitivity Model: Where Range and Density Matter
The inputs are illustrative, except the diesel and electricity prices above. Replace them with your own; the structure matters more than the values.
- Purchase premium: €12,000 over a comparable diesel van, spread over a 5-year hold (€2,400 a year), before incentives, residual differences, financing and depot charger capex.
- Energy use: diesel 8 l/100 km; electric 25 kWh/100 km.
- Prices: electricity €0.1837 per kWh; diesel €1.594 (February) or €2.237 (September) a litre.
- Maintenance saving: €0.03 per km.
- Operating year: 250 days. Usable range: 180 km.
Break-even daily distance (km) by diesel price and purchase premium
| Diesel price | €8,000 premium | €12,000 premium | €16,000 premium |
|---|---|---|---|
| €1.59 (23 Feb) | 57 km | 86 km | 115 km |
| €1.80 | 50 km | 75 km | 100 km |
| €2.00 | 44 km | 67 km | 89 km |
| €2.24 (28 Sep) | 39 km | 59 km | 79 km |
Annual EV advantage per van by route profile, €12,000 premium
| Route profile | Stops a day | Km per stop | Daily km | At €1.59 diesel | At €2.24 diesel | Status |
|---|---|---|---|---|---|---|
| Dense core | 120 | 0.35 | 50 | -€1,005 | -€362 | Below floor |
| Mixed urban | 80 | 0.9 | 90 | +€111 | +€1,268 | In window |
| Suburban | 60 | 1.6 | 130 | +€1,227 | +€2,899 | In window, thin range buffer |
| Regional | 45 | 4.0 | 230 | Not applicable | Not applicable | Beyond usable range |
Daily distance includes 8, 18, 34 and 50 km of stem distance.
What moves the mixed urban route’s €1,268 advantage, with each input changed by 20%
| Input | Effect on annual advantage |
|---|---|
| Daily distance | ± €734 |
| Diesel price | ± €805 |
| Purchase premium | ± €480 |
| Electricity price | ± €207 |
| Maintenance saving | ± €135 |
| Usable range | €0 |
Range scores zero on this route because it sits inside the window. It matters only at the edge: the suburban route loses its entire €2,899 advantage if usable range falls below 130 km, a 28% shortfall on the 180 km base.
Density shows up only through daily distance. A denser route needs fewer kilometres per stop, which lowers cost per stop for diesel and electric vans alike, but it also shortens the day’s distance and thins the electric van’s savings. The densest route in the table is below the floor at today’s diesel price. Break-even for it would need diesel at about €2.60. The Amsterdam €3,000 incentive would cut a €12,000 premium to €9,000 and the floor to 44 km.
Range-First vs Density-First vs Window Planning: Key Differences
| Dimension | Range-first | Density-first | Window planning |
|---|---|---|---|
| Question asked | Which van has enough range? | Which routes are densest? | Which routes sit between the floor and usable range? |
| Optimises | Vehicle specification | Stop clustering | Daily distance against payback |
| Typical purchase | Longest-range van | Vans for the densest depots | Vans for in-window routes |
| Blind spot | Pays for range on routes that never need it | Densest routes can fall below the floor | Needs post-optimisation distance data |
| Reacts to diesel price | No | No | Yes, floor is recomputed |
What to Look for in EV Route Planning Software
Post-optimisation distance reporting. Ask whether the tool reports the distribution of daily route distance after optimisation, with stem distance, because that distribution is the input to the window.
Usable-range modelling. Range should be a hard constraint that reflects payload and temperature, not a flat figure from the data sheet.
Vehicle-to-route matching across mixed fleets. The software should assign electric and diesel vans to routes in the same planning pass, so electrified distance follows the in-window routes.
Urban access rules per stop. Zero-emission and low-emission zone eligibility should apply at stop level, because a route is only as permitted as its strictest zone.
Auditable cost and emissions reporting. Look for before-and-after fuel, energy and emissions records that finance and sustainability teams can both use.
Route Density and Distance in Action: Real-World Results
These Locus deployments were not electrification programmes. They show how far a routing programme moves daily distance, the variable the payback window depends on.
A beverage distributor running vans, trucks and motorbikes from depots to thousands of small retail points in Vietnam. Moving from spreadsheet planning to automated route planning cut fuel use by 37%, raised orders per trip by 22%, reduced distance travelled by 12% and cut planning time by 35%. Fewer kilometres per delivery is exactly what pushes a route toward the floor of the EV window.
A global FMCG distribution network across ten countries with 1,000+ distributors and 5,000+ riders. The operation eliminated 12,000+ trips a month, cut distance by 15% and reduced plan generation from 3 hours to 5 minutes, at 3X ROI. Eliminating a trip removes its distance in full, so routes should be sized for EVs after this kind of programme, not before.
Common EV Payback Mistakes to Avoid
Sizing the order on rated range. A 300 km rating is a 180 km asset in service. Paying for range the routes do not use, or counting on range that cold weather and payload remove, both distort the case.
Sizing on pre-optimisation kilometres. If optimisation cuts distance by 12 to 15%, a route that cleared the floor yesterday may fall below it tomorrow.
Electrifying the densest routes first by default. Dense routes are the shortest. In the model, the densest route loses money on energy savings alone and should be electrified only where access rules require it.
Treating the fuel price as fixed. The 2026 diesel rise moved the €12,000-premium floor from 86 km to 59 km a day. A business case built in February understates the payback of September.
How Locus Matches Electric Vans to the Routes Where They Win
Locus, the world’s first Decision-Intelligent, Agentic TMS, was recognized by Gartner for seven consecutive years and appears in the 2026 Hype Cycle for Supply Chain Execution and Logistics Technologies. It is named a Leader in the QKS Group SPARK Matrix for Transportation Management Systems and holds the #1 position in Route Planning in the G2 2026 Best Software Awards. In October 2025, Ingka Investments, the investment arm of Ingka Group, the world’s largest IKEA retailer, acquired Locus. Locus continues to operate independently.
The Capacity agent evaluates electric vehicles within the same decisioning surface as diesel vehicles, across 250+ real-world constraints per dispatch decision, so each route goes to the vehicle that can serve it at the lowest cost. The Dispatch agent builds the routes through Locus’s route planning system, and constraints include vehicle range, payload and urban access rules. Governance includes adjustable autonomy levels, explainability, traceability and human-in-the-loop approval. Locus has optimized 1.5B+ deliveries for 360+ enterprise customers across 30+ countries, and its CSRD scope 3 offering supports the reporting side.
Two cases show the routing effect: the Vietnam beverage distributor that cut fuel use by 37%, and the global FMCG network that reached 3X ROI. To map your own routes against the window, schedule a demo.
For European CFOs asking whether range or density decides EV payback, Locus plans against both: it sets routes first, then matches electric and diesel vans to the distance window where each pays back, so electrification follows the economics rather than the spec sheet.
Frequently Asked Questions
What decides EV van payback in European urban delivery? Daily distance decides it. An electric van repays its purchase premium through energy and maintenance savings per kilometre, so a route needs enough daily distance to earn the premium back and a short enough distance to stay within usable range.
Is battery range or route density more important for EV ROI? Neither decides alone. Range is a gate that excludes routes longer than usable range, and density determines daily distance, which sets where a route sits above or below the payback floor. In the model, range changes nothing for in-window routes.
How many kilometres a day does an electric van need to pay back? In the illustrative model, with a €12,000 premium, 250 operating days and diesel at €2.24 a litre, the floor is about 59 km a day. At the February diesel price of €1.59 it was 86 km. Your premium, energy use and operating days will change the figure.
How did the 2026 diesel price rise change EV payback? EU average diesel prices rose about 40% between February and September 2026, which widens the saving per kilometre. In the model, the floor for a €12,000 premium fell from 86 km to 59 km a day, bringing shorter routes into the window.
Does route optimisation help or hurt EV payback? Both. Optimisation lowers cost per stop for every vehicle, but it also shortens routes, which can push a route below the payback floor. Run the window analysis on post-optimisation distances before buying.
How do zero-emission zones affect the EV business case? Where a zone requires an emission-free van, access value sits on top of payback and can justify an electric van on a route that fails on distance alone. Amsterdam requires new vans within the S100 ring road to be emission-free, so prices that access value as a separate line.


General
US Peak Season Carrier Allocation: How Retailers Should Split Parcel Volume Across Carriers in Q4 2026

Oct 7, 2026
UPS, FedEx and USPS peak surcharges differ by weight, zone and date. How US retailers should split parcel volume across carriers in Q4 2026.
Read more
General
Best TMS for Canadian Retail Enterprises in 2026: Eight Platforms Compared Based on Canada’s Challenges

Oct 7, 2026
Compare the best TMS platforms for Canadian retail on distance, winter, Quebec's French rules, CUSMA and parcel disruption, and see why Locus leads.
Read moreInsights Worth Your Time


















European EV Fleet Payback: Range or Density? What Decides the ROI of Electric Vans in 2026