


General
Supply Chain Control Tower for North American Shippers: Why Predictive Analytics Beats Real-Time Dashboards for Holiday Import Waves

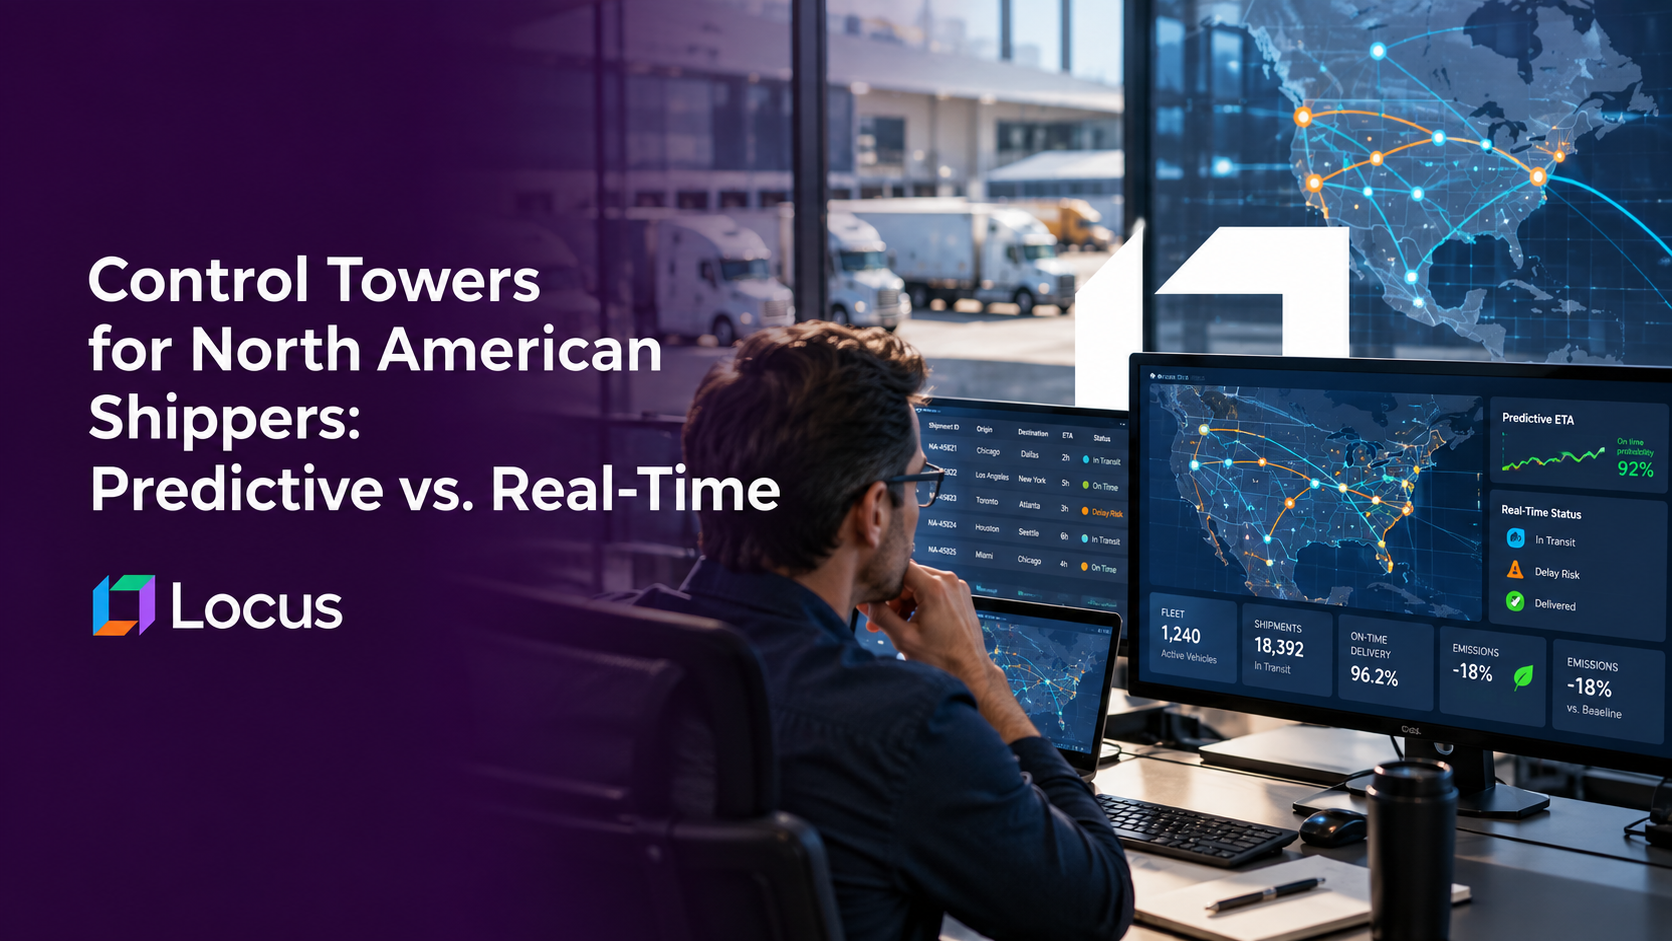
During the peak North American holiday import wave, logistics control centers across the continent light up with red icons. Port container dwell times stretch at West Coast gates, intermodal rail ramps experience severe chassis shortages, and drayage fleets hit capacity ceilings.
In response, enterprise operations leads gather around real-time visibility dashboards. Millions of dollars have been spent connecting GPS telematics, AIS vessel tracking, and EDI status feeds to produce glowing, live maps of global inventory.
Yet, despite total real-time visibility, shipments still miss promotional windows, store shelves sit unreplenished, and expedited freight charges soar.
The uncomfortable truth for Directors of Operations is that real-time visibility is inherently reactive. Knowing precisely where a container is stuck in real time does nothing to prevent it from getting stuck in the first place. When import volumes surge, real-time dashboards merely give you a front-row seat to an inevitable operational failure.
To survive peak holiday import waves, North American shippers must move past passive tracking and deploy Predictive Control Towers capable of converting early disruption signals into autonomous, pre-emptive re-allocation decisions.
To explore how enterprise technology leaders build control towers with execution authority, read our guide on Why Most Supply Chain Control Towers Don’t Actually Control: What CTOs Need to Build for Operational Authority.
Key Takeaways
- The Real-Time Fallacy: Real-time dashboards confirm delays after they occur; predictive control towers model network bottlenecks days before containers dock.
- Pre-Emptive Re-Allocation: Absorbing holiday import surges requires re-routing inventory while it is still in transit, shifting drayage and fulfillment hubs dynamically.
- Visibility to Execution Gap: A control tower without automated re-dispatch capabilities is just an expensive monitoring tool; real leverage requires linking predictive analytics directly to execution engines.
The Operational Paradox: Why Real-Time Visibility Fails Under Peak Import Pressure
When holiday import volumes hit North American gateways (LA/Long Beach, NY/NJ, Savannah, Vancouver), logistics networks experience acute non-linear congestion. Under standard volume, a 10% increase in port throughput causes minor delays. During peak import waves, that same 10% surge causes exponential delays across three primary choke points:
1. Drayage and Port Gate Dwell Cascades
A ocean container arriving at a congested West Coast terminal sits in stack storage. A real-time tracking dashboard updates its status to “Container Discharged.” Two days later, it updates to “Terminal Dwell: 48 Hours.” By the time a dispatcher sees the red flag on their dashboard, the drayage driver has missed their gate appointment, demurrage fees have started accruing, and downstream warehouse labor shifts sit idle.
2. Intermodal Rail Ramp Bottlenecks
Containers transferred to inland rail corridors (e.g., Chicago, Dallas, Memphis) frequently face chassis shortages at destination ramps. A real-time system tracks the train’s GPS coordinates along the route. However, it fails to evaluate chassis availability at the receiving railhead 72 hours away, resulting in container grounding and missed store delivery windows.
3. Last-Mile Fulfillment Center Overload
When delayed import containers finally clear port gates simultaneously, they arrive at regional fulfillment centers in uncoordinated clusters. Receiving docks become overwhelmed, cross-dock operations freeze, and last-mile dispatchers run out of available fleet capacity.
Also Read: Supply Chain Control Tower: How to Build Real-Time Logistics Visibility That Delivers ROI
Predictive Control Tower Architecture: From Passive Tracking to Pre-Emptive Action
Predictive control towers do not wait for milestone events to update a dashboard. Instead, they run continuous machine learning models against upstream network signals to forecast disruption windows days before they manifest on the ground:
1. Early Signal Ingestion
Monitors AIS vessel speed anomalies, port anchorage queues, West Coast labor productivity rates, and weather patterns 10 to 14 days before vessel berth.
2. Dynamic ETA & Dwell Risk Scoring
Calculates container-level probability of delay at every handoff point (vessel to drayage, drayage to rail, rail to cross-dock) using predictive risk scoring.
3. Autonomous Pre-Emptive Re-Allocation
Evaluates 250+ operating constraints to re-allocate orders, shift drayage appointments, or re-route inbound inventory to secondary fulfillment hubs before congestion locks the primary gateway.
Deep Dive: Pre-Emptive Re-Allocation in Practice
Consider a high-volume retail shipper importing holiday electronics through Long Beach destined for Midwest fulfillment hubs:
- The Reactive Real-Time Approach: The system tracks the vessel docking, logs a 5-day terminal dwell delay, alerts the operations lead, and waits for a human planner to manually find alternative domestic 3PL capacity at spot-market rates.
- The Predictive Control Tower Approach: Five days before the vessel arrives, the control tower detects rising anchorage queues and chassis deficits in Long Beach. It automatically triggers a pre-emptive re-allocation decision: re-routing a portion of the shipment via East Coast/Gulf water routes or initiating immediate transloading at a near-port warehouse to bypass railhead delays entirely.
Also Read: Real-Time ETA Accuracy: The New Battleground for Customer Retention in North American Logistics
Comparative Matrix: Passive Dashboards vs. Predictive Control Towers
Evaluate your North American visibility architecture against these core execution metrics:
| Operational Dimension | Passive Real-Time Dashboard | Predictive Control Tower (Locus) |
|---|---|---|
| Data Methodology | Historical milestone updates & GPS pings | Early signal ingestion & predictive risk scoring |
| Primary Output | Color-coded status maps & delay alerts | Automated, pre-emptive re-allocation plans |
| Exception Timeline | Identifies delays after they occur | Forecasts bottlenecks 3 to 7 days in advance |
| Demurrage Protection | Low (Alerts sent after dwell fees start) | High (Automates drayage slot re-scheduling pre-arrival) |
| Execution Authority | None (Requires human dispatcher intervention) | Autonomous re-dispatching within governed guardrails |
| Holiday Peak Performance | High ticket volume & manual firefighting | Smooth, capacity-optimized import flow |
Also Read: How Does AI Improve Supply Chain Visibility?
How Locus Empowers North American Shippers During Peak Import Waves
Locus provides enterprise shippers with an Agentic Control Tower platform that converts visibility data into execution intelligence:
- Predictive Risk Modeling: Evaluates port dwell trends, drayage capacity, and intermodal schedules to calculate true container arrival times long before ships dock.
- Pre-Emptive Multi-Carrier Orchestration: Leverages dynamic carrier allocation engines to shift overflow inbound freight across 3PLs and regional fleets before primary networks breach SLAs.
- 250+ Operating Constraints: Simultaneously balances drayage appointment windows, warehouse receiving capacity, driver working hours, and fuel costs during peak volume spikes.
- Closed-Loop Execution Intelligence: Integrates directly with enterprise ERP, WMS, and TMS platforms to execute re-routing decisions automatically, updating inventory availability across all channels.
Also Read: Real-Time Control Tower: A CTO’s Architectural Evaluation Framework
Move Beyond Passive Tracking This Holiday Season
Relying on real-time dashboards to manage North American holiday import waves guarantees costly firefighting, late deliveries, and eroded margins. Deploying a Predictive Control Tower gives operations leaders the foresight to anticipate disruptions and the execution authority to resolve them before they impact the bottom line.
Schedule a Demo with Locus to discover how our Decision-Intelligent platform transforms logistics visibility into pre-emptive operational leverage.
FAQs
1. What is the difference between a real-time tracking dashboard and a predictive control tower?
A real-time tracking dashboard reports where inventory currently is, highlighting delays after they happen. A predictive control tower uses machine learning to forecast delays days in advance, automatically executing pre-emptive re-routing and carrier re-allocations to prevent the disruption entirely.
2. How do predictive control towers reduce port demurrage and detention fees?
By forecasting terminal dwell bottlenecks 3 to 5 days before vessel discharge, predictive control towers automatically re-sequence drayage gate appointments and transload schedules, ensuring containers clear port gates before penalty windows begin.
3. Can a predictive control tower execute decisions automatically?
Yes. An Agentic Control Tower operates within policy-backed guardrails set by supply chain leadership. When a predicted delay breaches SLA thresholds, the system can autonomously re-tender orders to backup carriers or adjust fulfillment hub assignments without requiring manual dispatcher intervention.
4. Why are real-time visibility tools insufficient for holiday peak season planning?
During peak holiday waves, capacity across ports, rail, and drayage becomes hyper-constrained. Once a real-time dashboard flags a delayed shipment, alternative capacity is often already sold out. Predictive analytics are necessary to secure capacity and re-route freight before bottlenecks occur.


General
Multi-Fleet Dispatch Automation for European CEP Operators: Coordinating Captive, 3PL, and Gig Capacity in One Layer

Sep 25, 2026
Learn how European CEP operators orchestrate captive, 3PL, and gig capacity in a single dispatch layer. Optimize real-time allocation, lower cost-per-drop, and handle volume surges.
Read more
General
The 6-Criteria Framework for Sustainable Fleet Transition in US Logistics (2026): Green Fleet Without Breaking SLAs

Sep 25, 2026
An opinionated 2026 framework for VPs of Supply Chain transitioning to commercial EVs in North America without compromising delivery SLAs or escalating cost-per-mile.
Read moreInsights Worth Your Time


















Supply Chain Control Tower for North American Shippers: Why Predictive Analytics Beats Real-Time Dashboards for Holiday Import Waves