


General
Real-Time Delivery Visibility: 7 KPIs Every Logistics Leader Should Track in 2026

Key Takeaways
- Most visibility programs are evaluated on whether the platform was implemented rather than on whether decisions improved. The seven KPIs below measure the second.
- Real-time is a decision window, not a refresh rate. Data is real-time if it arrives while you can still change the outcome, which differs by decision type.
- Exception detection lag is the highest-leverage metric on the list, because every downstream recovery option narrows while it runs.
- Published benchmarks for delivery visibility metrics do not trace to research firms. Baseline your own operation and measure improvement against it.
- Two measures separate programs that work from programs that report: proactive notification rate and exception resolution without human intervention.
The cost of visibility that is not quite real time
A tracking system that updates every fifteen minutes feels real-time in a demo and is not real-time in an operation. The gap shows up in specific places: a delivery window is missed because the delay surfaced after the customer was already waiting, a customer service agent quotes a status the driver moved past twenty minutes ago, a vehicle sits at a facility because nobody knew it had arrived.
None of these look like visibility failures. They look like execution failures, which is why visibility programs are frequently judged successful while the operation continues to run on phone calls.
The evidence that this is the normal state rather than the exception is direct. Gartner found that only 22 percent of shippers with more than 1 billion dollars in revenue believe their supply chain control tower is highly effective at driving action. In the same body of work, Gartner found that while 95 percent of supply chains must react quickly to change, only 7 percent can execute decisions in real time.
The data is arriving. What is missing is a way to tell whether it arrives in time to matter, which is what these seven KPIs measure.
What “real time” actually means
Vendors use the term for three different things, and the distinction is worth having in your own vocabulary before the next demo.
Event-driven. State changes are pushed as they occur, typically via webhook. The delay between the physical event and its availability is seconds.
Near real-time. The system polls a source on a short cycle, commonly one to fifteen minutes. The average delay is half the polling interval, so a fifteen-minute cycle means the average exception is seven and a half minutes old when you see it.
Batch. Scheduled transfers, hourly to daily. Appropriate for reference data and financial reconciliation, not for anything you might act on today.
The useful test is not the number. It is whether the data arrives inside the decision window for the action it should trigger. A carrier delay that arrives in four minutes is real-time if you can still reassign the last-mile leg, and is a historical record if you cannot. That makes “real time” a property of the pairing between data and decision, not a specification.
Also Read: The Real-Time Decision Surface: A Framework for US CTOs Evaluating AI Logistics Orchestration
The seven KPIs at a glance
| KPI | What it measures |
|---|---|
| ETA accuracy rate | How often the arrival time you communicated matched what happened, at the precision you communicated it |
| Exception detection lag | Elapsed time from the physical event to the exception being visible to someone who can act |
| Event completeness by carrier | The share of shipments where every expected status was actually received |
| Location data freshness | Age of the most recent position for an in-progress delivery, by fleet and carrier |
| First-attempt delivery rate | Share of deliveries completed without a second attempt |
| Proactive notification rate | Share of exceptions where you told the customer before they asked |
| Exception resolution without intervention | Share of disruptions absorbed by the system rather than escalated to a person |
A note before the detail. You will find published benchmark tables for most of these metrics. Those figures do not trace to research firms, government sources, or peer-reviewed work; the versions in circulation originate with software vendors and aggregator pages. Rather than plan against numbers with no methodology, baseline your own operation over 30 days, segmented as described under each KPI, and measure improvement against that with the method documented.
1. ETA accuracy rate
What it measures. The percentage of deliveries that arrived within the window you communicated, measured at the precision you actually communicated. A four-hour window and a thirty-minute window are different products and should not share a metric.
Why it matters. ETA accuracy is the input to almost every other customer-facing outcome, and it is the operational expression of reliability. McKinsey found that speed fell from consumers’ number one delivery priority in 2022 to fifth by 2024, displaced by reliability and predictability, with around 90 percent of consumers willing to wait two to three days when delivery is free and arrives within the stated window.
How to baseline it. Segment by window precision, by metro, and by carrier. Aggregate accuracy conceals the two or three markets producing most of the misses, and it hides the difference between a wide window you always hit and a narrow one you rarely do.
What moves it. Service time accuracy per location, live traffic and access data, and whether the ETA recalculates during the route or is fixed at dispatch.
2. Exception detection lag
What it measures. Elapsed time from the physical event, a failed attempt, a breakdown, a delay threshold breach, to the moment it is visible to a person or system able to act.
Why it matters. This is the highest-leverage number on the list, because every recovery option narrows while the clock runs. A delay detected in four minutes can be absorbed by resequencing; the same delay at forty minutes is a missed window and a customer conversation.
How to baseline it. Measure by event type and by carrier, using the carrier’s own event timestamp against your system’s receipt timestamp. Polling-based integrations will show a distribution roughly half the polling interval wide, which is itself the finding.
What moves it. Event-driven integration instead of polling, and whether exceptions route to a queue or trigger recalculation directly.
3. Event completeness by carrier
What it measures. The share of shipments where each expected canonical status was actually received, calculated per carrier.
Why it matters. Completeness gaps are why shipments “go quiet.” A missing status is invisible on a dashboard, which shows what arrived rather than what did not, so this is the metric that surfaces the absence. It is also the clearest input to a carrier conversation, because it is factual and fixable.
Blind spots at this layer are a general condition rather than a local failure. Gartner has found that 80 percent of the supply chain is not accounted for in current digital decision models.
How to baseline it. Define your canonical status set first, then measure per carrier per status. Regional carriers typically show thinner coverage than national networks, which is expected and should be planned for rather than treated as a defect.
4. Location data freshness
What it measures. The age of the most recent position report for an in-progress delivery, measured across the active fleet rather than as a configured interval.
Why it matters. Configured refresh intervals and actual freshness diverge in the field through connectivity gaps, app backgrounding, and device battery management. The configured number is a setting; freshness is the reality, and ETA quality depends on the second.
How to baseline it. Measure the distribution rather than the average, by fleet type and by geography. The tail is what matters, since the stale outlier is the delivery your ETA is wrong about.
What moves it. Driver application behaviour under poor connectivity, offline buffering and reconciliation, and for contracted capacity, whether you receive position data at all.
5. First-attempt delivery rate
What it measures. The share of deliveries completed without a second attempt.
Why it matters. It is the cleanest single indicator of whether visibility is producing better outcomes rather than better reporting, because most causes of failed attempts, wrong window, absent recipient, access problem, are addressable with information the operation could have had earlier.
How to baseline it. By metro and by customer segment rather than network-wide, and paired with structured failure reason codes. Without reason codes the metric tells you there is a problem and nothing about which one.
On published benchmarks: figures circulating for first-attempt failure rates trace to delivery software vendors and aggregators rather than to research, which makes your own trend the only defensible reference.
6. Proactive notification rate
What it measures. The share of exceptions where the customer was informed before they contacted you.
Why it matters. This is the difference between a customer experiencing competence and a customer experiencing failure, and it maps to loyalty directly. Gartner research on customer effort found 96 percent of customers who have a high-effort service experience become disloyal, against 9 percent of those with a low-effort experience, and chasing a parcel is a high-effort experience regardless of how it resolves.
How to baseline it. Compare exception timestamps against outbound notification timestamps and inbound contact timestamps. The three together also give you the distribution of how much warning you provided, which is more useful than the binary.
What moves it. Exception detection lag, which is why KPI two sits upstream of this one.
7. Exception resolution without intervention
What it measures. The share of disruptions resolved by the system, through resequencing, reassignment, or automated customer communication, without a person joining data from two places to decide.
Why it matters. It is the metric that separates visibility from execution. A program can score well on detection and completeness while every exception still consumes twenty minutes of a coordinator’s day, and that is a program that will not scale with volume.
How to baseline it. Categorise exceptions by type, then measure the share resolved autonomously within each category. Expect wide variance: resequencing is usually automatable, product disposition decisions frequently should not be.
Building the dashboard around them
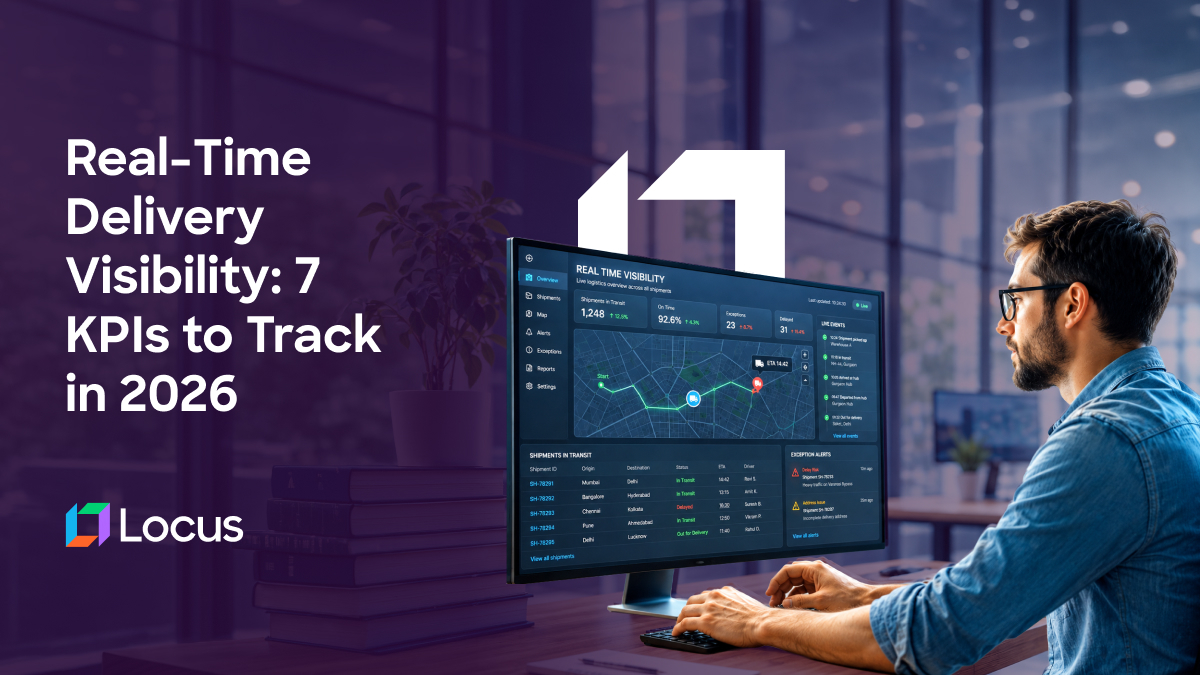
A dashboard that shows shipments is a map. A dashboard that shows decisions is an operating tool. Eight elements, in order of usefulness.
- Exceptions requiring a decision, filtered to those where the automated response was unavailable, at the top and above the fold.
- Exception detection lag, live, so degradation in a feed is visible as it happens rather than in a monthly review.
- At-risk deliveries, meaning in-progress orders whose current ETA has moved outside the committed window, not deliveries already late.
- Event completeness by carrier, as a running figure, since this is where silent data loss appears.
- Proactive notification rate for the current day, which tells the customer service lead whether they are ahead of the queue or behind it.
- First-attempt rate trend by metro, weekly rather than daily, since daily noise obscures the signal.
- Location freshness distribution, showing the stale tail rather than the average.
- Autonomous resolution share by exception type, which is the measure of whether the operation is scaling.
Two things to keep off it: total shipment counts, which nobody acts on, and any metric aggregated to network level without a segment breakdown, which is where the actionable variance goes to hide.
When evaluating a platform to supply this, ask for uptime commitments on the customer-facing tracking surface specifically rather than on the application overall, and ask what the configured position reporting interval is against what freshness the platform actually observes in production.
Also Read: Why Real-Time Visibility Fails: The Data-Quality Problem Behind the Dashboard
Where these numbers come from in practice
Locus, the world’s first Decision-Intelligent, Agentic TMS, is built so that exceptions trigger decisions rather than notifications. Within DiSCO, the Dispatch agent recalculates affected routes on an event, the Customer agent issues the revised commitment, and Control Tower gives operations and customer service the same live view. Because notification is generated from the decision rather than from a status field, the ETA a customer receives reflects what the system just decided.
Locus has been recognized by Gartner for seven consecutive years, featured in the 2026 Hype Cycle for Supply Chain Execution and Logistics Technologies, named a Leader in TMS by QKS Group (SPARK Matrix), and ranked #1 in Route Planning on G2’s 2026 Best Software Awards. In October 2025, Ingka Investments, the investment arm of Ingka Group, the world’s largest IKEA retailer, acquired Locus. Locus continues to operate independently.
Two deployments show KPI movement rather than platform adoption. A leading North American retailer running freight across ocean, rail, DC, hub, and store previously surfaced exceptions only after delays had reached store service. With real-time visibility and automatic exception routing, on-time store delivery moved above 99 percent with exceptions resolved in under two hours across the network, which is KPI seven expressed as an operating standard. A leading Canadian grocery brand had status scattered across carrier portals, with support hunting for updates ticket by ticket and the first signal of a late order usually being the customer. With one view, live status, and real-time SLA alerts, support resolution became 10 to 20 times faster.
Where to start
Pick two: exception detection lag and proactive notification rate. They are upstream of most of the others, they are measurable with data you already hold, and the gap between them tells you immediately whether your visibility investment is producing decisions or reports.
If you want to see these surfaced in one view rather than assembled from exports, that is a conversation worth having with your platform team before the next peak.
Learn more, visit locus.sh
Frequently Asked Questions (FAQs)
What KPIs measure real-time delivery visibility?
Seven: ETA accuracy rate, exception detection lag, event completeness by carrier, location data freshness, first-attempt delivery rate, proactive notification rate, and the share of exceptions resolved without human intervention. The first four measure whether the visibility layer is working; the last three measure whether it is changing outcomes, which is the question most programs never answer.
What does real-time mean in logistics visibility?
Practically, it means data arrives inside the decision window for the action it should trigger. Event-driven integration delivers state changes in seconds, near real-time polling delivers them at roughly half the polling interval on average, and batch delivers on a schedule. A four-minute delay notification is real-time if you can still reassign the leg and a historical record if you cannot.
What is a good ETA accuracy rate?
There is no research-grade published benchmark, and figures in circulation trace to software vendors rather than to research firms or government sources. Measure your own accuracy segmented by window precision, metro, and carrier over 30 days, then track improvement against that baseline. A wide window you always hit and a narrow window you often miss are different products and should not share a target.
Why is exception detection lag the most important visibility metric?
Because every recovery option narrows while it runs. A delay detected within a few minutes can be absorbed by resequencing the remaining stops; the same delay detected after forty minutes is a missed window, a customer conversation, and possibly a failed attempt. It is also upstream of proactive notification rate, so improving it improves two KPIs at once.
How do you measure whether a visibility platform is actually working?
Compare exception detection lag against proactive notification rate, and measure the share of exceptions resolved without a person joining data from two systems. A platform that detects well but escalates everything is producing reports. Gartner found only 22 percent of shippers above 1 billion dollars in revenue consider their control tower highly effective at driving action, which is the gap those two measures expose.
What should a logistics visibility dashboard show?
Decisions before data. Exceptions requiring a human decision at the top, live exception detection lag, at-risk deliveries whose ETA has moved outside the committed window, event completeness by carrier, today’s proactive notification rate, weekly first-attempt trend by metro, location freshness distribution including the stale tail, and autonomous resolution share by exception type. Total shipment counts and unsegmented network aggregates should be left off.


General
Last-Mile Carrier Tracking in North America: How Enterprise Logistics Teams Do it Right

Aug 20, 2026
How North American enterprise teams build last-mile carrier tracking that works across regional, national, and cross-border carriers: a canonical status taxonomy, event granularity by audience, and exception thresholds that trigger action.
Read more
General
Driver Management Under AB5 and Prop 22: A Workforce Architecture Playbook for California Last-Mile Operators
Aug 20, 2026
How California last-mile operators structure driver management across W2, app-based, and 3PL capacity to protect SLAs while managing classification exposure, and what the dispatch platform has to do.
Read moreInsights Worth Your Time


















Real-Time Delivery Visibility: 7 KPIs Every Logistics Leader Should Track in 2026