General
Essential Logistics KPI Examples and Formulas: Track the Right Metrics in 2026
TL;DR: Logistics KPIs are measurable metrics that help enterprise logistics leaders in retail, e-commerce, and 3PL operations optimize delivery performance, reduce costs, and improve customer satisfaction through data-driven decision making.
Key Takeaways
- For enterprise logistics leaders, KPIs quantify delivery speed, accuracy, cost, and return performance across complex supply chains.
- Metrics like first-attempt delivery rate and order accuracy help isolate operational delays and fulfillment issues.
- Return rate, cost per shipment, and lead time expose high-friction areas in delivery and reverse logistics.
- Each KPI connects directly to corrective actions, rerouting, warehouse retraining, or customer communication updates.
- Locus empowers logistics teams with AI-driven KPI tracking integrated into dispatch logic and control systems for real-time operational adjustments.
For retail, e-commerce, and 3PL operations leaders managing high-volume logistics networks, one of the KPIs essential for evaluating last-mile reliability is on-time delivery rate. It measures the percentage of orders delivered within the promised window, offering a direct view into how well fulfillment meets customer expectations.
When logistics teams start monitoring this metric, it often surfaces delays that volume-based metrics obscure. High delivery counts may look promising, yet repeated timing failures in specific zones or time slots can erode SLA performance and customer trust.
Because on-time delivery rate can be segmented by region and time band, it allows teams to pinpoint problem areas, recalibrate dispatch schedules, and reassign routes with greater accuracy. These targeted changes often lead to measurable gains in delivery consistency and fewer service complaints.
In this blog, we explore which logistics KPIs deliver the most value in 2026, and how Locus delivers AI-driven logistics orchestration—helping enterprises cut costs, boost delivery reliability, and achieve real-time control over every mile.
What Does KPI Mean in Logistics?
A logistics KPI (Key Performance Indicator) is a clearly defined metric that quantifies performance in specific segments of the supply chain, transportation, warehousing, fulfillment, or reverse logistics. Moreover, these KPIs differ from general operational statistics by linking performance to specific strategic goals, such as on-time delivery, cost per shipment, or order accuracy.
Each KPI captures a particular operational dimension. For example, order accuracy rate reflects the precision of inventory management and picking systems, while first-attempt delivery rate indicates how well last-mile logistics align with customer availability and routing efficiency.
For enterprise logistics operations, these KPIs are usually categorized as:
- Transportation KPIs: delivery timelines, route efficiency, fuel cost per mile
- Warehouse KPIs: picking accuracy, throughput per hour, space utilization
- Fulfillment KPIs: lead time to delivery, perfect order rate, order cycle time
- Order Management KPIs: order cycle time, order fill rate, backorder rate
With the help of these metrics, teams can isolate inefficiencies and prioritize improvements. A rise in fuel cost per mile, for instance, may signal suboptimal routing logic or vehicle underutilization.
For multi-channel operations, KPIs translate business goals into tactical action. Tracking first-attempt delivery rate helps CEP networks reassign drivers and adjust slotting where failure rates compromise SLA compliance.
Each KPI serves a defined operational role, whether reallocating resources, tightening time windows, or isolating avoidable delivery failures.
How to Set Up Logistics KPIs
Setting up effective logistics KPIs requires a structured approach that aligns metrics with business objectives and operational capabilities. Here’s a step-by-step guide for enterprise logistics leaders:
- Identify Business Objectives: Define clear goals such as reducing delivery costs, improving customer satisfaction, or increasing operational efficiency
- Select Relevant Metrics: Choose 10-15 KPIs that directly impact your objectives and can drive actionable decisions
- Ensure Data Availability: Verify that you have reliable data sources and collection mechanisms for each chosen KPI
- Set Benchmarks: Establish baseline performance levels and target improvements based on industry standards and historical data
- Establish Review Processes: Create regular monitoring schedules and assign ownership for each KPI to ensure accountability
| KPI Category | Key Metrics | Typical Benchmark |
| Transportation | On-Time Delivery Rate | 95-98% |
| Warehouse | Order Accuracy Rate | 99.5%+ |
| Last-Mile | First Attempt Delivery Rate | 85-90% |
| Cost Control | Cost per Order | Varies by industry |
Suggested read: AI in Logistics and Supply Chain
Essential Logistics KPI Examples and Formulas
For retail, e-commerce, and 3PL operations leaders, tracking specific KPIs across different stages of logistics operations helps pinpoint inefficiencies, reduce costs, and improve service levels across complex supply chains. Below are essential logistics KPIs, along with their formulae and detailed explanations.
Transportation KPIs
Transportation costs and efficiency are crucial for optimizing enterprise logistics networks. These KPIs help monitor performance in delivering goods to customers.
🚚 On-Time Delivery Rate:
Measures the percentage of deliveries made on or before the promised delivery time.
Formula:
This KPI indicates the reliability of delivery processes and route planning. Locus enhances on-time delivery rates through AI-powered route optimization and real-time traffic analysis.
💸 Transportation Cost per Mile
Tracks the cost incurred for each mile traveled during transportation. It includes fuel, labor, and vehicle maintenance costs.
Formula:
Monitoring this metric helps identify opportunities to reduce costs by optimizing routes or improving fleet efficiency.
📦 Vehicle Capacity Utilization
Measures the efficiency of how well a vehicle’s available capacity is being used.
Formula:
A higher percentage indicates better fleet management and fewer empty miles, leading to cost savings.
⛽ Fuel Efficiency
Measures how many miles are covered per unit of fuel, typically expressed as miles per gallon (MPG) or kilometers per liter (KPL).
Formula:
Optimizing fuel efficiency is key to lowering transportation costs and reducing environmental impact.
Warehouse and Inventory KPIs
These KPIs assess how well inventory is managed in enterprise warehousing operations, which directly impacts order fulfillment speed and cost efficiency. Key metrics include picking accuracy, throughput per hour, and stockout rate.
🔄 Inventory Turnover Ratio
Indicates how frequently inventory is sold and replaced over a period.
Formula:
A higher ratio suggests better inventory management, reducing the risk of overstocking or understocking.
🎯 Order Accuracy Rate
Tracks the percentage of orders fulfilled without errors (e.g., wrong items, quantities, or damages).
Formula:
High accuracy in order fulfillment minimizes returns, improves customer satisfaction, and reduces operational costs.
⏱️ Putaway Time
Measures the time taken to move goods from receiving to storage in the warehouse.
Formula:
Reducing putaway time enhances overall warehouse efficiency and speeds up order fulfillment.
📐 Space Utilization
Calculates the percentage of total warehouse space effectively utilized for storage.
Formula:
Optimizing space utilization reduces storage costs and increases operational efficiency.
Order Management KPIs
Order management is a core logistics function for enterprise operations. These KPIs track the efficiency of order processing from receipt to fulfillment:
- Order Cycle Time: Total time from order placement to delivery completion
- Order Fill Rate: Percentage of orders fulfilled completely from available inventory
- Backorder Rate: Percentage of orders that cannot be fulfilled immediately due to stock unavailability
- Order Lead Time: Time between order placement and shipment dispatch
Delivery and Last-Mile KPIs
The final stage of delivery, last-mile, is often the most critical for customer satisfaction in enterprise logistics. These expanded KPIs include delivery time, number of shipments, and customer satisfaction rate.
📍 Last-Mile Delivery Success Rate
Measures the percentage of deliveries successfully completed in the last-mile stage without issues (e.g., delivery errors, delays).
Formula:
A high success rate indicates well-managed last-mile operations, leading to greater customer satisfaction.
✅ First Attempt Delivery Rate (FADR)
Tracks the percentage of deliveries made successfully on the first attempt.
Formula:
Improving FADR reduces operational costs related to redeliveries and enhances customer experience by ensuring timely deliveries.
⚠️ Delivery Exception Rate
Measures the percentage of deliveries that encounter issues (e.g., delays, damages, missed deliveries).
Formula:
A low delivery exception rate reflects well-coordinated operations, while a high rate highlights areas for improvement.
Cost and Efficiency KPIs
Cost control is critical in logistics. These KPIs help balance service quality with financial sustainability.
💰 Cost per Order
Measures the total cost involved in fulfilling a single order, including transportation, warehousing, and handling costs.
Formula:
Lowering the cost per order helps businesses maintain profitability without compromising service quality.
📊 Logistics Cost as % of Sales
This KPI tracks logistics expenses relative to total sales revenue.
Formula:
Keeping this percentage low indicates efficient cost management relative to sales growth.
📋 Perfect Order Rate
Measures the percentage of orders delivered on time, complete, and without damage.
Formula:
A high perfect order rate is a strong indicator of efficient logistics and high customer satisfaction.
Real-Time Tracking and Orchestration KPIs
Real-time monitoring provides operational visibility, helping businesses make informed decisions and react quickly to disruptions.
🗂️ Orders Planned vs. Orders Dispatched
This KPI compares the number of orders planned for dispatch versus the actual orders dispatched.
Formula:
A discrepancy between planned and dispatched orders suggests inefficiencies in planning or order availability.
🤖 % of Orders Auto-Assigned
Measures the percentage of orders automatically assigned to vehicles using route optimization algorithms.
Formula:
A higher percentage shows better utilization of automated systems to enhance operational efficiency.
🚀 Dispatch Efficiency
Tracks how efficiently orders are assigned and processed in the dispatch phase.
Formula:
A higher dispatch efficiency rate leads to faster order fulfillment and reduced delays.
🛠️ Control Tower Resolution Time
Measures the time taken to resolve issues detected by a logistics control tower, such as route changes or delivery disruptions.
Formula:
A lower resolution time indicates a proactive response to disruptions, minimizing the impact on delivery timelines.
Locus empowers logistics teams to take real-time action on KPIs by embedding them directly into dispatch and monitoring workflows. As recognized by Gartner and trusted by global leaders like Unilever and Nestlé, Locus has optimized over 1.5B deliveries across 30+ countries. Tools like DispatchIQ and Control Tower adjust routes, flag SLA risks, and surface cost or delivery issues as they emerge, helping teams correct course before problems escalate.
KPI Dashboards and Scorecards
Effective KPI tracking requires robust visualization and monitoring tools. Dashboards and scorecards provide real-time visibility into logistics performance, enabling quick decision-making and proactive issue resolution.
Essential Dashboard Components
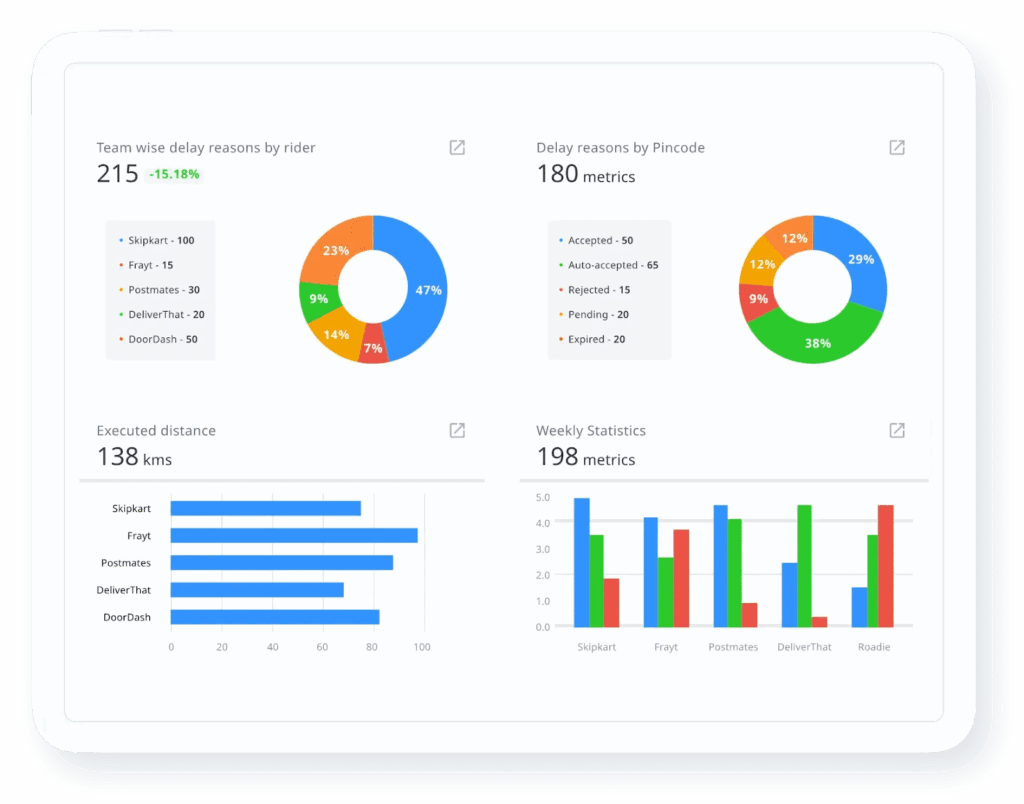
- Real-time Performance Metrics: Live updates on delivery status, route efficiency, and exception alerts
- Trend Analysis: Historical data visualization to identify patterns and improvement opportunities
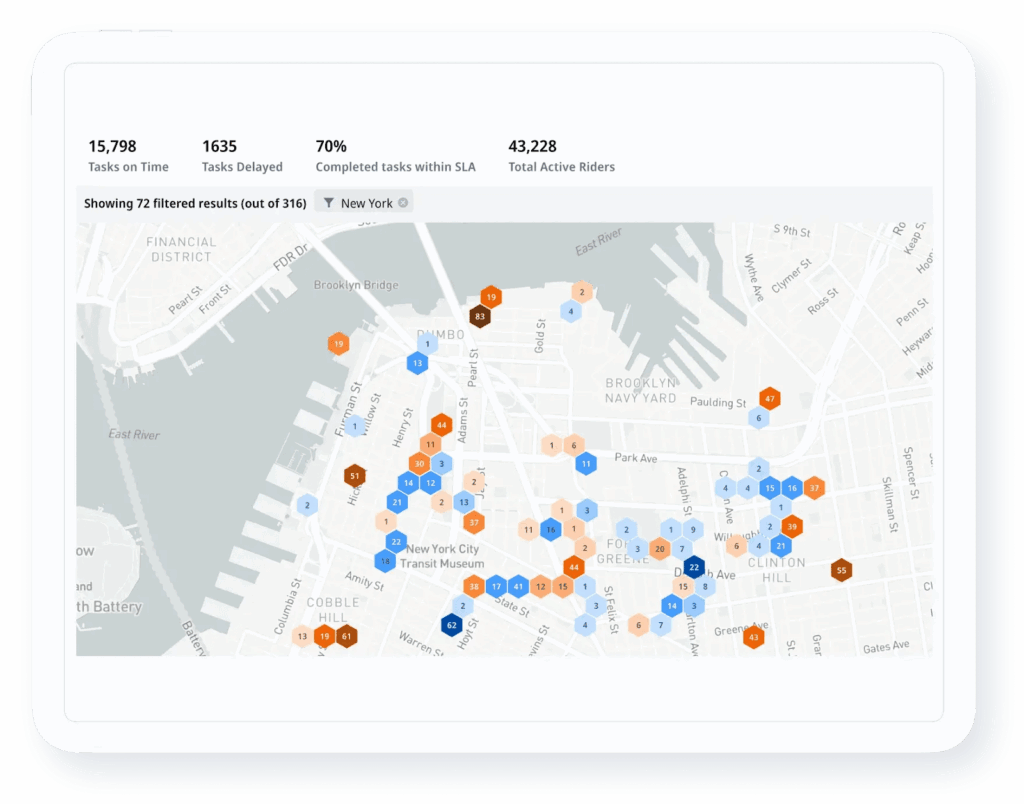
- Geographic Views: Map-based displays showing delivery performance by region and zone
- Alert Systems: Automated notifications when KPIs fall below threshold levels
Best Practices for KPI Dashboard Design
- Focus on actionable metrics that drive immediate operational decisions
- Use color coding and visual indicators for quick status assessment
- Provide drill-down capabilities for detailed analysis
- Ensure mobile accessibility for field operations teams
Common Mistakes When Tracking Logistics KPIs
Avoiding common pitfalls in KPI implementation ensures your logistics performance measurement program delivers maximum value:
- Tracking Too Many Metrics: Focus on 10-15 critical KPIs rather than overwhelming teams with excessive data
- Lack of Alignment with Business Goals: Ensure each KPI directly supports strategic objectives
- Poor Data Quality: Invest in reliable data collection and validation processes
- Failing to Act on Insights: Establish clear processes for responding to KPI alerts and trends
- Inconsistent Definitions: Standardize KPI calculations across all teams and systems
Suggested read: 4 Best Retail Logistics Software Companies in 2025
Why Logistics KPIs Are Essential to Operational Control
Well-designed logistics KPIs turn daily execution into measurable progress for enterprise operations teams. They give managers the tools to focus resources, validate decisions, and improve delivery performance with precision. Rather than reacting to delays or rising costs after the fact, teams use KPIs to identify patterns, test adjustments, and scale what works.
1. Diagnosing Delays Before They Escalate
Metrics like order-to-ship time and lead time to delivery distinguish upstream issues, such as inventory holds or processing lags, from downstream delays in routing or handoffs. This clarity enables targeted intervention across specific functions, instead of broad troubleshooting.
Use case: A retail brand used lead time breakdowns to flag inconsistent pick-and-pack cycles at one warehouse, resolving the delay without touching fleet operations.
2. Prioritizing Interventions with Limited Resources
Disruptions affect performance unevenly, making it essential to distinguish between high- and low-impact issues. KPIs such as first-attempt delivery rate or cost per shipment by zone help managers assess which decisions, rerouting, time slot revisions, or driver reassignments, have the strongest operational payoff.
Use case: A 3PL optimized cost per delivery in low-density regions by reshaping zones based on past failure patterns.
3. Coordinating Across Teams and Systems
When KPIs like return rate by reason are consistently defined, they align teams across functions. Product, packaging, and logistics can collaborate around shared data to reduce avoidable returns or damage-related complaints.
Use case: A CPG brand identified transit-related damage trends and adjusted packaging for specific SKUs, cutting returns by 15%.
4. Enabling Accountability Through Measurable Targets
Performance KPIs like perfect order rate or SLA compliance provide the foundation for setting benchmarks, managing partner performance, and motivating frontline teams with outcome-driven goals.
Use case: A delivery network used zone-level SLA dashboards to benchmark hubs and recognize top-performing routes weekly.
Logistics KPIs make performance visible, actionable, and repeatable, supporting better decisions at every stage of fulfillment.
Benefits of Tracking the Right KPIs
Logistics KPIs serve as execution signals, not summaries. When tracked consistently, they help managers direct effort, optimize planning, and scale operational decisions with precision.
1. Granular Visibility for Focused Action
KPI dashboards allow performance to be segmented by shift, route, carrier, and facility. Enterprise teams can focus on specific process gaps, such as a zone with rising exception density or a shift with declining pick accuracy, without reviewing entire workflows.
2. Shorter Time to Intervention
Defined KPI thresholds trigger operational checks at the point of deviation. Teams respond before missed targets affect downstream operations, reallocating drivers, adjusting cutoff times, or modifying zone boundaries on the same day.
3. Consistent Delivery Performance
Tracking fulfillment and delivery KPIs by lane or product category reduces variability in timing, accuracy, and service quality. Teams maintain service-level consistency across urban and rural zones, weekdays and weekends, or high- and low-volume cycles.
4. Smarter Resource and Capacity Planning
Historical KPI trends support shift planning, zone configuration, and carrier allocation. For example, fleet size can be adjusted based on weekday vs. weekend route performance, and pick-line staffing can reflect past throughput metrics.
Locus empowers these outcomes by embedding real-time KPI tracking into routing engines, Control Tower views, and exception workflows, so performance data feeds directly into decisions that shape each day’s execution.
Turn KPIs into Execution Levers
For enterprise logistics teams managing high volumes across regions, logistics KPIs, when clearly defined and tied to execution, guide targeted interventions across every layer of fulfillment. They expose route-level inefficiencies, surface recurring bottlenecks, and quantify the operational impact of delays, misroutes, and returns. KPI tracking is essential to sustaining performance and scaling capacity with control.
Locus empowers logistics teams to act on these signals through Dispatch Management and Control Tower, which use real-time KPI inputs to adjust routing logic, manage SLA risk, and surface exception patterns. These tools feed into Analytics & Insights, which consolidates performance data into customizable dashboards, enabling teams to monitor trends, drill into metrics, and align decisions across regions and partners.
See Your Logistics KPIs in Action—Schedule A Demo to see how Locus helps logistics teams move from KPI tracking to real-time execution, across dispatch, delivery, and post-fulfillment control.
Frequently Asked Questions (FAQs)
1. How many logistics KPIs should an operations team track?
Focus on 10–15 KPIs that map directly to daily decisions, across delivery, warehouse, and returns. Tracking too many metrics can dilute focus and slow response.
2. What makes a logistics KPI effective?
A useful KPI is process-specific, consistently measurable, and tied to an actionable outcome, like reallocating routes or revising slot logic.
3. Can KPI benchmarks vary by region or delivery type?
Yes. SLA expectations, route density, and customer behavior differ by geography and service model. KPI targets should reflect these operational realities.
4. How often should KPI dashboards be reviewed?
Live dashboards should be monitored daily. Deeper trend reviews, like zone-level exception spikes or return patterns are typically done weekly or monthly.
5. What role does automation play in KPI tracking?
Automation tools like Locus use KPIs as triggers, rerouting orders, adjusting driver allocation, or escalating exceptions, without waiting for manual intervention.

General
What Are Postal Carrier Routes? A Complete Guide in 2025
Sep 18, 2025
A comprehensive guide explaining postal carrier routes as optimized delivery paths that help businesses reduce costs, improve efficiency, and enhance customer experience through strategic route planning and modern optimization software.
Read more
AI in Action at Locus
The Practical Path to AI-Ready TMS: Embellishments that Work Today
Sep 22, 2025
AI Embellishments deliver smarter workflows through practical, low-risk steps that prepare your TMS for the agent-driven future.
Read moreInsights Worth Your Time


Essential Logistics KPI Examples and Formulas: Track the Right Metrics in 2026