


General
Integration Event Loss in 2026: What 10% Missing Events Costs Your Exception Data
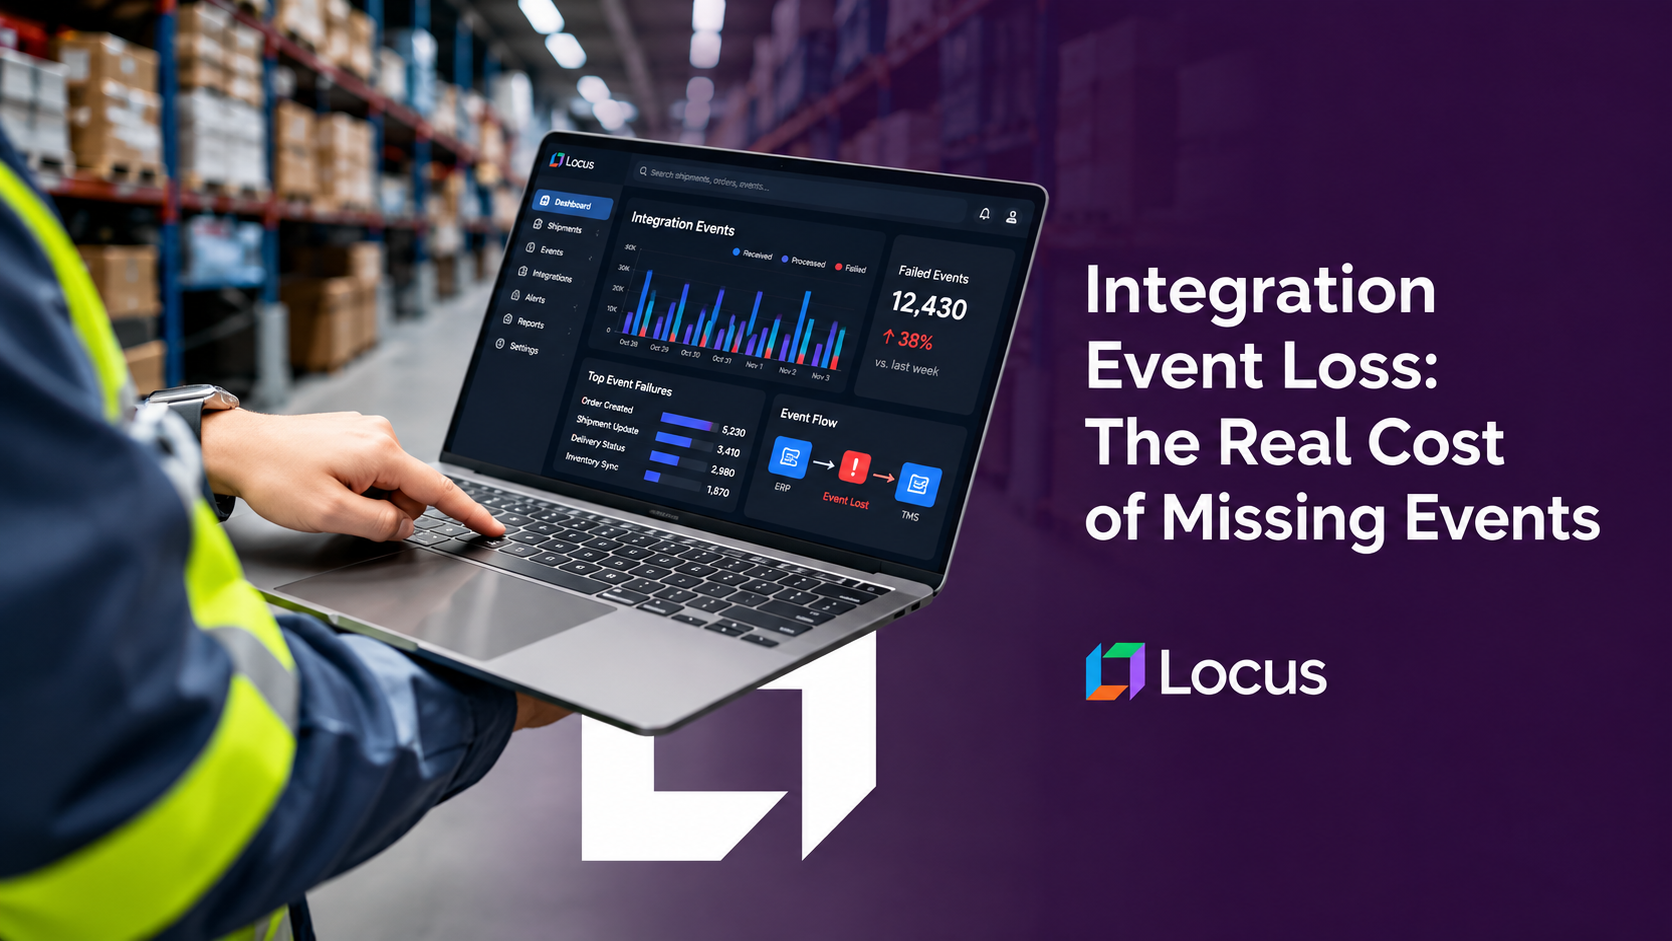
Integration event loss is the share of status events emitted by carriers, drivers and partner systems that never reach the system meant to record them. It matters more than the headline percentage suggests, because losses do not distribute evenly across outcomes: a delivered event that goes missing is usually corrected by the next one, while a failed-attempt event has no second carrier and its information is gone permanently. Modeling shipment event sequences at a 10% loss rate puts 10% of shipments in a wrong final state and 27% of exception shipments with an incomplete record, which means every metric derived from exceptions reads better than reality. Locus, the world’s first Decision-Intelligent, Agentic TMS, harmonizes partner event streams into one standard set and reconciles them against the executed plan, so a missing event is detected rather than absorbed.
Key Takeaways
- Message transports guarantee at-least-once delivery, so loss, duplication and reordering are properties of the architecture rather than faults to be fixed away.
- At a uniform 10% event loss rate, 10.0% of shipments ended in a wrong final state while 27.0% of exception shipments lost part of their exception record, a ratio of 2.7 to one.
- That asymmetry needs no clustering assumption. It follows from terminal events correcting state and exception events having no second carrier.
- Measured first-attempt success read 83.6% against a true 82.0%, because a lost failure event is indistinguishable from a success. The bias only ever flatters.
- Loss rates differ by partner, so carrier scorecards built on exception data partly rank integration quality rather than delivery performance.
- Locus reasons across more than 250 real-world constraints and reconciles harmonized partner events against the executed plan, which is what makes a missing event visible.
Why Event Loss Is Not Evenly Distributed: The Business Case
Start with what the transport actually promises. Amazon’s documentation for standard queues states that they ensure at-least-once message delivery, but due to the highly distributed architecture, more than one copy of a message might be delivered, and messages may occasionally arrive out of order. That is the normal guarantee across event-driven systems, and it means duplication, reordering and loss are design parameters rather than defects. An integration that assumes exactly-once delivery is not conservative, it is incorrect.
The reason a loss rate matters unevenly is that shipment events are not interchangeable. A delivery generates a short sequence ending in a definitive event, and that terminal event overwrites whatever came before it. An exception generates a longer sequence in which several events carry information that appears nowhere else: which attempt failed, why it failed, what was rescheduled. Losing an intermediate event on a clean delivery is self-correcting. Losing a failed-attempt event is not.
Nothing in an availability dashboard reveals this, which is why it persists. The pattern is well documented in adjacent fields: IBM, citing Vectra’s 2023 survey of 2,000 security analysts, reports teams fielding thousands of alerts a day of which 67% are ignored due to a high volume of false positives and alert fatigue. When the monitoring is green and the volume is high, degradation is absorbed rather than noticed.
There is a sharper commercial consequence than a mis-stated internal metric. Carrier scorecards are built from exception data, and loss rates differ by partner because each integration is a different piece of engineering. A carrier with a mature event feed reports its own failures reliably; one with a weaker feed reports fewer of them. Rank carriers on that data and the ranking rewards integration quality as much as delivery performance, which is not what the scorecard is for and not what the contract renewal should turn on.
The commercial exposure sits where the money is. With last mile running 60% to 70% of total parcel delivery cost, and exception handling concentrated inside that, an operation measuring its exception performance from an incomplete record is optimizing against a number it cannot see clearly. The volume trend makes it worse: the World Economic Forum projects 36% more delivery vehicles in the top 100 cities globally by 2030, and event volume scales with them.
| Also Read: Your Integrations Aren’t Down, They’re Wrong: The Silent Failure Modes in Logistics Connectivity |
|---|
How a Lost Event Becomes a Wrong Number
1. A shipment emits a sequence, not a single status
Created, planned, out for delivery, delivered, proof of delivery. An exception inserts several more: attempt failed, reason code, reattempt scheduled, sometimes an address correction and a replan.
2. Each event crosses a transport that can drop it
At-least-once delivery means the transport will retry, but a consumer that is down, throttled or slow past the retry window still loses the message. Aggregate loss rates in the low single digits to low double digits are ordinary.
3. A terminal event repairs the state behind it
If out-for-delivery is lost but delivered arrives, the record resolves correctly. The terminal event is definitive and it overwrites the gap, which is why clean shipments are resilient to loss.
4. An exception event has no second carrier
Nothing later in the sequence restates that the first attempt failed or why. If that event is lost, the information does not arrive in another form, and the shipment reads as though it went smoothly.
5. The wrong number is the derived metric, not the status
The delivery still shows as delivered, on time, with proof captured. What degrades is first-attempt rate, failure reason analysis, carrier scorecards and the root-cause work built on all three.
6. The error is directional
A lost failure event makes performance look better. There is no symmetric mechanism that invents failures, so the bias accumulates in one direction across every reporting period, and it is largest in the periods with the most events to lose. Peak season, when exception volume and integration load both rise, is when the reported numbers are least reliable and most closely watched.
What the Model Shows
The model simulates several hundred thousand shipments across four paths from stated inputs rather than observed customer data: a clean delivery, a failed attempt followed by success, an address correction, and a return to origin. Each path emits a realistic event sequence. Events are then dropped at a uniform rate, with no assumption that losses cluster anywhere, and two outcomes are measured: whether the final recorded state is wrong, and whether the exception record is incomplete.
A uniform loss rate produces very non-uniform damage. At 10% event loss, 10.0% of shipments ended in a wrong final state and 27.0% of exception shipments lost part of their exception record. At 5% the figures were 4.9% and 14.1%, at 2% they were 1.9% and 5.8%, and at 20% they were 20.1% and 48.7%.
The asymmetry is roughly three to one and needs no special pleading. The ratio between exception-record loss and final-state error ran 3.0 at a 2% loss rate, 2.9 at 5%, 2.7 at 10% and 2.4 at 20%. This is not caused by losses concentrating on exception paths. It follows from the structure of the sequences: the final state has a definitive event that repairs it, and the exception record does not.
Every exception-derived metric reads better than reality. With a true first-attempt success rate of 82.0%, the measured rate at 10% event loss came out at 83.6%, at 5% loss 82.8%, and at 2% loss 82.3%. A lost failure event is indistinguishable from a delivery that never failed, so the measurement drifts upward with the loss rate and never downward.
Calibrating the published figure. Locus has previously published that a 10% aggregate loss can mean a 40% loss on exceptions, attributing the concentration to losses clustering on unusual paths. This model reaches 26.8% with no clustering at all. Getting to roughly 40% requires exception-carrying event types to be lost at about 1.5 times the base rate, which produces 38.5%, or 1.75 times for 43.4%. The direction of that earlier claim is right and the mechanism is real, but the magnitude depends on an elevation the original statement did not quantify.
The floor is the more useful number. Because 26.8 points of the effect arrive from sequence structure alone, an operation can treat roughly a quarter of its exception records being incomplete at 10% event loss as a baseline that holds without assuming anything about where losses fall. Any clustering on top of that is additional.
What the model does not settle. It treats loss as independent per event, which understates correlated outages. A consumer down for ninety minutes does not lose a scattered 10% of events, it loses every event in that window, and the shipments affected are those active at that moment rather than a random sample. Correlated loss is worse than the figures here, not better. The model also assumes a single terminal event per path, and it excludes duplicates and reordering, both of which the same transports produce and which corrupt state through different mechanisms.
Clean Paths and Exception Paths: Key Differences
| Dimension | Clean delivery | Exception path |
|---|---|---|
| Events emitted | Short sequence, definitive ending | Longer sequence, several unique events |
| Effect of losing one event | Usually repaired by the terminal event | Information gone, nothing restates it |
| Wrong final state at 10% loss | 10.0% | 10.0%, same terminal exposure |
| Incomplete record at 10% loss | Not applicable | 27.0% |
| Visible in delivery reporting | Yes, status is wrong | No, status is usually right |
| Metric affected | On-time and delivered counts | First-attempt rate, reason codes, scorecards |
| Direction of error | Either way | Always flattering |
What to Look for in Integration Reliability
Reconciliation against an independent record
Event completeness cannot be judged from the event stream, because a stream missing events looks exactly like a quieter operation. It has to be reconciled against something that knows what should have happened, which in practice means the executed plan. The useful question to put to a vendor is direct: show me a shipment where an expected event never arrived, and show me how long it took to notice.
Per-event-type monitoring, not aggregate throughput
An aggregate volume check passes while a specific rare event type disappears entirely. Monitoring should be per type and per partner, with expected ratios between types rather than absolute counts.
Sequence validation rather than field validation
A payload can be individually valid and arrive in an impossible order. Checking that a shipment’s events form a legal sequence catches loss and reordering that schema validation cannot, because it tests the relationship between events rather than the contents of each one. A delivered event with no preceding out-for-delivery is structurally suspicious even though both records are perfectly formed.
Idempotency and replay as standing capability
At-least-once transports require idempotent consumers keyed on an event identifier, dead-letter capture for persistent failures, and a replay path for recovering a missed window. These are table stakes rather than differentiators, and their absence is worth confirming directly.
Harmonized partner statuses under one vocabulary
Where each carrier reports its own status codes, completeness cannot even be defined, because there is no shared expectation of which events should exist. Normalizing to one set is the precondition for detecting that one is missing.
Event Integrity in Practice
A leading ASEAN apparel retailer. Last mile ran almost entirely through carriers, each reporting its own status codes, with no trustworthy delivery date at checkout and hundreds of thousands of delivery and returns complaints in a single half-year. Harmonizing every carrier’s statuses into one standard set cut WISMO and returns queries by more than 40%. Until the vocabulary is shared, a missing event cannot be distinguished from an event that carrier never sends.
A leading North American retailer. Ocean, rail and road ran through six separate legacy systems, so an exception in one mode stayed invisible in the others until it arrived as a store-level stockout. Consolidation produced more than $1M in savings with exceptions resolved in under two hours. Six systems means six event streams and six independent opportunities to lose the event that mattered.
A Fortune 50 parcel and logistics network. More than a million freight shipments a year across 51 sites and a 4,500-strong driver pool, each site measuring itself against its own plan. Centralizing raised weekly execution from 75% to 92% and surfaced more than $14M in unused capacity, including $565K at a single site. Local measurement hides gaps in exactly the way an incomplete event record does: everything reconciles against itself, so every site’s numbers are internally consistent and collectively wrong. The capacity was not hidden by bad data in any individual system. It was hidden because no system held the reference the others could be checked against.
Common Mistakes in Managing Event Completeness
Treating an aggregate loss rate as the impact. A 10% loss rate is not a 10% problem. It produced a 10% final-state error and a 27% exception-record error in this model, and the second is the one that corrupts decision-making.
Monitoring uptime and payload validity only. Both can be green while a specific event type stops arriving. Completeness is a third property, distinct from availability and from correctness, and the absence of a thing is harder to alert on than the presence of a broken one. It needs an expectation to test against, which is why reconciliation rather than monitoring is the control that catches it.
Trusting first-attempt rate without checking event completeness. The measured rate is biased upward by the loss rate, always in the flattering direction. An operation congratulating itself on a first-attempt improvement should confirm the improvement is not a reporting artifact, particularly if an integration changed in the same period. A feed that got quieter and a network that got better look identical in the metric.
Assuming exactly-once delivery. The transports in use guarantee at-least-once. Building as though each event arrives exactly once produces duplicates under retry and silent gaps under outage, and testing rarely surfaces either because tests send each message once.
How Locus Protects Event Integrity
Locus, the world’s first Decision-Intelligent, Agentic TMS, treats partner event streams as inputs to be reconciled rather than records to be trusted. Carrier statuses are harmonized into one standard vocabulary so completeness becomes definable, and the Control Tower compares that stream against the executed plan for every open order, which is the independent reference an event stream cannot provide for itself. The route planning and dispatch layer reasons across more than 250 real-world operating constraints and retains the plan version each shipment departed from, so an expected event that never arrives is a detectable divergence rather than a quiet absence. Six governance mechanisms covering explainability, traceability, evaluation, autonomy levels, execution sandbox and human-in-the-loop keep each decision traceable to the state that produced it, which is what allows an operation to tell the difference between an exception that did not happen and one it never heard about.
The platform reasons across those constraints over 1.5B+ deliveries for 360+ enterprise customers in 30+ countries at 99.99% uptime, with $320M+ in aggregate logistics cost savings, 800M+ miles reduced and 17M+ kg of CO2 avoided. Locus has been recognized by Gartner for seven consecutive years, including the 2026 Gartner Hype Cycle for Supply Chain Execution and Logistics Technologies and the 2026 Gartner Market Guide for Multicarrier Parcel Management Solutions, where ShipFlex is featured as a Representative Vendor. Locus holds Leader designation in the QKS SPARK Matrix for Transportation Management Systems 2025 and the #1 position for Route Planning in G2’s 2026 Best Software Awards. In October 2025, Ingka Investments, the investment arm of Ingka Group, the world’s largest IKEA retailer, acquired Locus. Locus continues to operate independently.
Two deployments show what harmonized, reconciled event data changes. A leading ASEAN apparel retailer ran last mile through carriers that each reported their own status codes, leaving no trustworthy checkout date and hundreds of thousands of delivery and returns complaints in one half-year. After moving onto Locus, carrier onboarding fell from three months to three days, a 97% improvement, every carrier’s status was harmonized into one standard set synced to the order and warehouse systems, and WISMO and returns queries dropped more than 40%. A leading North American retailer consolidated six legacy systems spanning ocean, rail and road onto Locus, reaching more than $1M in savings, 99%+ on-time store delivery, 95%+ route compliance, exceptions resolved in under two hours and break-even inside year one. In both cases the operational gain and the data-integrity gain are the same change described twice.
A 10% event loss rate is not a 10% problem. Modeling shipment event sequences put 10.0% of deliveries in a wrong final state and 27.0% of exception shipments with a permanently incomplete record, a ratio near three to one that requires no assumption about where losses fall, and it pushed measured first-attempt success to 83.6% against a true 82.0%. Because terminal events repair state and exception events have no second carrier, the damage lands on precisely the shipments an operation most needs to understand, and it lands in the flattering direction. Locus harmonizes partner events and reconciles them against the executed plan, which is what turns a missing event from an absence into a detected divergence. Request a Locus integration integrity review to find out what your exception records are missing.
FAQs
What is integration event loss? It is the proportion of status events emitted by carriers, drivers or partner systems that never reach the system meant to record them. Because standard message transports guarantee at-least-once rather than exactly-once delivery, some loss under outage or throttling is a property of the architecture rather than a fault.
Does a 10% event loss rate mean 10% of data is wrong? No. In this model a uniform 10% loss produced a 10.0% final-state error but a 27.0% incomplete-record rate on exception shipments. The aggregate percentage understates the damage because losses land unevenly across outcomes.
Why do exceptions suffer more than clean deliveries? A clean delivery ends in a definitive event that repairs whatever was lost before it. An exception event such as a failed attempt or a reason code is stated once and nowhere else, so losing it removes the information permanently while the shipment still reads as delivered.
How does event loss affect first-attempt delivery rate? It inflates it. A lost failure event is indistinguishable from a delivery that never failed, so the measured rate drifts upward with the loss rate. At 10% loss the measured figure read 83.6% against a true 82.0%, and the bias never runs the other way.
How do you detect missing events? Not from the event stream, since a stream missing events looks like a quieter operation. Detection requires reconciliation against an independent record of what should have happened, monitoring per event type and per partner rather than in aggregate, and validating that each shipment’s events form a legal sequence.
What should an integration assume about delivery guarantees? At-least-once, with duplicates and out-of-order arrival possible. That implies idempotent consumers keyed on an event identifier, dead-letter capture with alerting, a replay path for a missed window, and a scheduled reconciliation comparing state across both systems.


General
How AI-Powered Route Optimization Tackles America’s Failed Delivery Crisis

Sep 25, 2026
Discover how AI route optimization cuts US failed deliveries by up to 35%. Learn how predictive analytics and dynamic ETAs eradicate the $17-per-miss operational drain.
Read more
General
Last-Mile Delivery Cost in 2026: Why the Number You Price New Business With is Eight Times Too Low

Sep 28, 2026
The incremental cost of a new account measured against today's routes came out at $0.70 a stop. Measured against the fleet you actually end up running, the same account cost $5.51. The accounting treatment moves the answer more than geography does.
Read moreInsights Worth Your Time


















Integration Event Loss in 2026: What 10% Missing Events Costs Your Exception Data