General
How Enterprise E-Commerce Teams Win Peak Season Logistics Without Operational Breakdown

Key Takeaways
- Peak season logistics e-commerce failures stem from orchestration gaps because manual dispatch and static planning cannot scale to 3–5x daily order spikes.
- Enterprise teams mapping global demand events to specific logistics pressure points gain 8–10 weeks of lead time for procurement, carrier negotiation, and capacity pre-positioning.
- AI-driven demand forecasting at the SKU-location-day level eliminates the lag of static S&OP cycles, shifting logistics teams from reactive triage to anticipatory planning.
- Multi-carrier dispatch automation routes shipments on real-time cost, SLA, and carrier capacity signals, reducing peak-season shipping cost overruns by 15–25%.
- Real-time visibility with predictive ETA engines and automated exception management deflects WISMO inquiry volumes tripling in November and December, per Forrester research.
- Post-peak analytics translate operational data into carrier renegotiation intelligence, network redesign decisions, and investment prioritization for the following cycle.
Peak season logistics for e-commerce exposes a structural gap between the non-linear physics of holiday demand and the linear capacity of manually operated supply chains. Every year, enterprise logistics teams face the same collision. Daily order volumes spike 3–5x in compressed windows, carriers hit capacity ceilings, and fulfillment hubs running smoothly in September buckle by the first week of November.
Locus’s experience navigating peak season logistics across global retail and 3PL networks shows the difference between brands protecting margins and those absorbing nine-figure expedited shipping costs comes down to orchestration intelligence. Preparation checklists do not stop the breakdown. Coordinated, AI-driven execution does.
This guide covers demand forecasting, multi-carrier dispatch, real-time route optimization, and post-peak analysis for enterprise e-commerce and 3PL operations leaders.
Why Peak Season Keeps Breaking E-Commerce Supply Chains
Enterprise-scale peak season failures are system failures, where multiple compounding pressures hit the supply chain simultaneously and overwhelm the manual coordination mechanisms working the rest of the year adequately.
What the 2024 holiday season revealed
Adobe Analytics recorded $241.1 billion in U.S. e-commerce spending across the 2024 holiday season, a 9% year-over-year increase. Black Friday alone drove $10.8 billion in a single day, up 10.2% from 2023.
The demand was real. For many retailers, so was the delivery SLA erosion. Parcel networks are saturated. Carrier surcharges activated. Last-mile capacity built for average daily volumes could not absorb the surge.
Why the capacity gap is structural
The online retail logistics challenge runs deeper than a single season’s volume. Peak demand across global e-commerce does not arrive as a clean, forecastable wave. It arrives as simultaneous regional spikes tied to different cultural and commercial calendars. Black Friday and Cyber Monday in North America, Singles’ Day in China,
Diwali across South and Southeast Asia, and Christmas across most of the world all compress into a six-week window. When carrier capacity increases 1.5x but order volumes increase 4x, the delta does not disappear.
It flows directly into expedited shipping spend and missed SLA commitments. Manual dispatch, static route plans, and week-old S&OP forecasts cannot respond to a demand environment moving at that speed.
The Peak Season Calendar Enterprise Logistics Teams Must Not Ignore
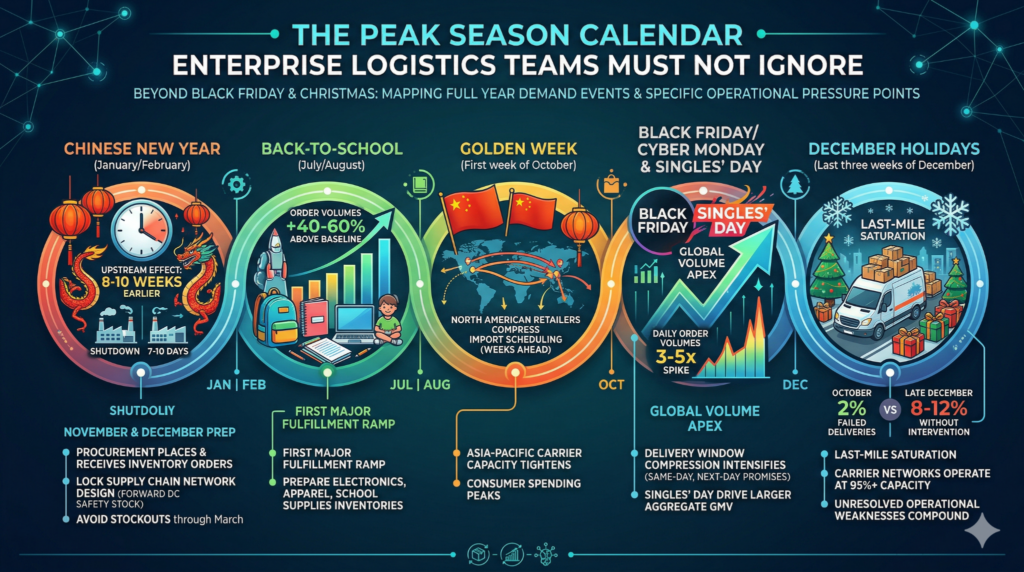
A peak season plan built only around Black Friday and Christmas is already behind. Enterprise logistics teams need to map the full year’s demand events to specific operational pressure points, because each event triggers a different preparation requirement.
Chinese New Year (January/February)
Factory shutdowns across China and Southeast Asia run seven to ten days, but the upstream effect extends 8–10 weeks earlier. Procurement teams at global retailers must place and receive inventory orders in November and December to avoid stockouts persisting through March.
Supply chain network design decisions, including which forward-positioned distribution centers hold safety stock, must lock before the Chinese New Year cuts off replenishment.
Back-to-school (July/August)
The first major fulfillment ramp of the year. Order volumes in electronics, apparel, and school supplies run 40–60% above baseline in July and August.
Golden Week (first week of October)
Consumer spending in China peaks sharply, Asia-Pacific carrier capacity tightens, and import scheduling for North American retailers compresses in the weeks ahead.
Black Friday/Cyber Monday and Singles’ Day (October/November)
The global volume apex. Singles’ Day drives a larger aggregate GMV than Black Friday globally, and the two events now overlap in promotional timing. Daily order volumes for enterprise e-commerce operations spike 3–5x. Delivery window compression intensifies because same-day and next-day promises made at checkout cannot be softened once peak demand hits.
December holidays (last three weeks of December)
Last-mile saturation. Carrier networks operating at 95%+ capacity tolerate no further compression. Any unresolved operational weakness from earlier in the peak period compounds here. A retailer carrying 2% failed deliveries in October will carry 8–12% in late December without targeted intervention.
Demand Forecasting That Actually Scales for Peak Periods
Most peak season guidance stops at “plan ahead.” For enterprise operations processing millions of orders across dozens of markets, the relevant question is how to forecast demand at the SKU-location-day level with enough precision to drive dispatch decisions.
Why historical-average models fail at peak
Historical-average models assume peak demand is a scaled version of normal demand. Peak demand behaves non-linearly. Promotional cannibalization shifts demand between SKUs and channels in ways historical averages cannot anticipate.
New market entry introduces demand patterns with no prior baseline. A model calibrated on last November’s data will underforecast in high-growth regions and overforecast in markets where discretionary spend has shifted. Static S&OP cycles running weekly or bi-weekly create a built-in lag multiplying under peak conditions.
How AI-driven demand sensing changes execution
Peak-period forecasting at enterprise scale requires a system ingesting real-time order signals, promotional calendars, regional consumption patterns, and external inputs, including weather and social trends, to generate continuously updating forecasts.
Locus’s demand intelligence layer operates this way. As new orders stream in, the system recalibrates dispatch plans autonomously rather than waiting for the next S&OP review cycle.
Logistics teams move from reacting to delivery exceptions to anticipating volume clusters before they create bottlenecks. When a promotional event generates 40,000 additional orders between 10 a.m. and 2 p.m., a dispatch plan last refreshed at 7 a.m. is already misaligned. Seasonal inventory management requires live data pipelines.
Carrier Diversification and AI-Powered Dispatch Under Surge Conditions
Single-carrier strategies and manual carrier-allocation processes all collapse under peak volume. Rate surcharges spike, SLA compliance drops, and carriers exercise capacity refusal rights buried in the service agreement.
Building a multi-carrier dispatch architecture
An enterprise multi-carrier dispatch strategy has four components.
- First, pre-negotiated rate cards with defined fallback carriers for each lane and service tier
- Second, dynamic allocation rules routing shipments on real-time cost-SLA tradeoffs rather than static carrier preferences
- Third, zone-skipping logic for high-density corridors, where direct injection into regional sortation hubs bypasses middle-mile congestion and compresses delivery windows
- Fourth, carrier performance scoring feeding back into allocation decisions in real time, so a carrier whose SLA compliance drops from 96% to 88% during week two of peak season receives proportionally fewer allocations in week three
How Locus automates carrier allocation at surge scale
Locus’s dispatch management engine executes this logic automatically across carrier pools. Automated route planning solutions integrated with Locus’s allocation layer assign shipments by weighing real-time carrier capacity, delivery window commitments, per-shipment cost, and historical performance scores in a single pass.
Dispatchers see the allocation output. Managing peak delivery challenges with consistent SLA outcomes replaces crisis-by-crisis decisions. Holiday season shipping strategies built on carrier diversification reduce peak-season shipping cost overruns by 15–25% compared to single-carrier operations, based on Locus customer data.
Route Optimization as a Peak Season Survival Lever
Generic advice about route optimization omits the specific conditions making peak-season routing different from the rest of the year.
Four routing challenges that only appear at peak scale
Delivery density in metro areas can triple during peak periods, collapsing the stop spacing routes, depending on on-time performance. Time-window compression from same-day and next-day SLAs reduces the driver’s margin for error on individual stops. Extended shifts create hours-of-service constraints, invalidating routes planned without driver status data.
Return logistics, specifically packages moving back through a last-mile network already saturated with outbound deliveries, create reverse-flow congestion that static routing models cannot accommodate.
How Locus handles route recalculation under live peak conditions
Locus’s AI route optimization engine addresses these conditions through continuous recalculation. As new orders enter the system, including returns flagged for pickup, the engine recalculates delivery sequences in real time, incorporating traffic data, weather, vehicle payload, and driver hours-of-service status.
A driver falling 20 minutes behind at stop four does not carry that deficit to every subsequent stop. The system detects the deviation, identifies which downstream stops can absorb a modified arrival window, and recalculates the sequence without requiring dispatcher intervention.
The sustainability gain competing content ignores
Peak season delivery strategies incorporating AI route optimization reduce deadhead miles (empty vehicle movement between delivery zones) and increase load consolidation per vehicle. For an enterprise fleet running 500 vehicles during peak, a 10% reduction in deadhead miles translates to material fuel savings and a measurable carbon footprint reduction enterprise procurement teams increasingly track for ESG purposes.
Real-Time Visibility: From Reactive Firefighting to Proactive Orchestration
A delayed shipment going undetected for four hours during normal operations affects one customer. During Black Friday afternoon, the same delay cascades across hundreds of downstream deliveries in the same carrier manifest as windows close in sequence.
What enterprise-grade visibility actually requires
E-commerce supply chain management during peak season requires visibility functioning as a control tower.
The four components distinguishing operational visibility from passive GPS pings are predictive ETA engines calculating arrival accuracy from live traffic and historical lane performance, automated exception alerts surfacing deviations before they breach SLA thresholds, carrier performance dashboards showing SLA compliance rates by lane and carrier in real time, and customer-facing tracking deflecting WISMO inquiry volume before it reaches support queues.
How Locus reduces WISMO volume and exception backlog
A majority of all customer service contacts during peak season are WISMO inquiries, and some retailers see those volumes triple in November and December.
Locus’s last-mile technology and real-time tracking layer have reduced WISMO contacts by 38% across its customer base by giving operations teams the predictive ETA accuracy to notify customers of delays before customers call in.
The Control Tower identifies at-risk shipments based on driver deviation, carrier performance trajectory, and time-window remaining, then triggers automated customer notifications before the SLA window closes.
Scaling Fulfillment Operations Without Proportional Cost Increases
Warehouse throughput ceilings, temporary labor onboarding friction, 3PL coordination overhead, and last-mile cost inflation during peak season share a common root. Fulfillment capacity was designed for average daily volume, and peak volume runs far above it.
Four strategies address the scaling challenge without proportional cost increases.
Regional fulfillment network activation
Forward-positioning inventory in regional distribution centers before peak demand arrives compresses last-mile delivery distances and reduces carrier zone costs. A retailer shipping from a single national DC pays zone 5–7 rates on most orders. The same retailer shipping from four regional DCs positioned near demand clusters pays zone 2–3 rates on the majority of volume.
For cross-border operations and multi-market 3PL networks, Locus’s cross-border e-commerce strategy framework outlines how to align inventory positioning with carrier network structure.
3PL capacity architecture
Base capacity from owned or contracted assets, overflow capacity from pre-negotiated 3PL agreements, and surge capacity from on-demand gig-economy drivers. Allocation logic across these three tiers must be automated. Manual assignment under peak volumes creates the dispatch delays, driving SLA failure.
Warehouse slotting for peak SKU velocity
The fastest-moving SKUs during peak periods need to sit closest to dispatch stations, with pick paths minimizing picker travel time. A slotting configuration optimized for July performance is wrong for December.
Centralized orchestration across fleet tiers
Locus’s dispatch engine coordinates e-commerce order fulfillment across captive fleets, contracted 3PL partners, and gig-economy drivers within a single allocation layer. Operations leaders see one queue, one performance dashboard, and one SLA tracking view regardless of how many fleet types are executing the volume. Locus customers with mixed-fleet operations have recorded a 45% increase in deliveries per day using the same fleet assets, and a 72% improvement in carrier allocation efficiency, by centralizing dispatch intelligence. For teams evaluating how to achieve last-mile logistics excellence at enterprise scale, the fleet coordination architecture matters as much as route planning.
Post-Peak Analysis: Turning Seasonal Chaos Into Structural Advantage
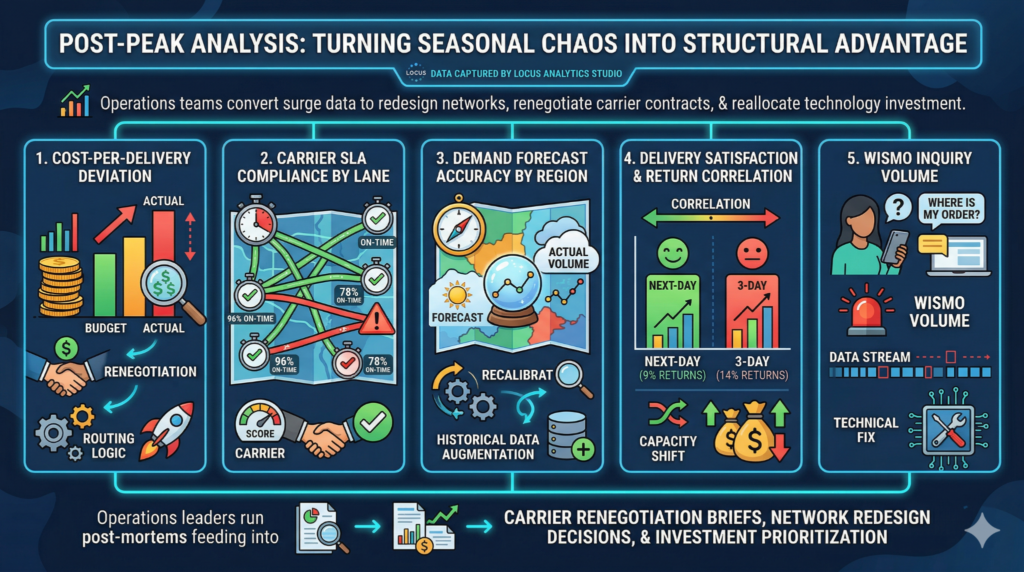
Operations teams converting peak season into a structural advantage use surge data to redesign networks, renegotiate carrier contracts, and reallocate technology investment before the next cycle begins.
Five metrics post-peak analysis should capture.
Cost-per-delivery deviation from plan
The gap between budgeted and actual cost-per-delivery by lane, carrier, and order type exposes where the peak season plan broke down financially. A 15% cost overrun on Zone 4 routes with a specific carrier signals both a renegotiation target and a routing logic problem.
Carrier SLA compliance rates by lane
Aggregate SLA compliance numbers conceal lane-level and carrier-level failures. A carrier delivering 96% on-time nationally but 78% on-time on one corridor needs a performance improvement conversation or a lane reallocation decision.
Demand forecast accuracy by region
The delta between the AI-generated forecast and actual order volume by region and day identifies where the demand model requires recalibration. Markets where the forecast underperformed by 20%+ need historical data augmentation before the next peak cycle.
Delivery satisfaction and return rate correlation
The correlation between delivery speed and return rate is operationally significant. A retailer seeing 14% returns on three-day deliveries and 9% returns on next-day deliveries has a financial case for shifting capacity investment toward faster delivery commitment.
WISMO inquiry volume by carrier and region
High WISMO volume on specific carriers or lanes signals a data integration problem in the carrier’s tracking API. The tracking data feed has gaps, and the fix is technical.
Locus’s Analytics Studio captures all of this during peak execution. Operations leaders run post-mortems feeding into carrier renegotiation briefs, network redesign decisions, and investment prioritization for the next cycle.
Building a Peak-Resilient E-Commerce Logistics Stack
Peak season resilience is an architecture decision made in January. September preparation sprints do not build it.
Enterprise logistics leaders evaluating peak-season readiness should audit five capability areas.
AI demand forecasting
Forecasting at the SKU-location-day level, updating continuously with real-time order signals, promotional calendars, and regional consumption patterns.
Dynamic multi-carrier dispatch
Pre-configured allocation rules across carrier pools, real-time cost-SLA tradeoff logic, and zone-skipping capability for high-density corridors.
Continuous route optimization
Delivery sequences recalculate as new orders enter the system and driver conditions change. Batch-planned routes break by noon on peak day.
Predictive visibility
ETA engines, automated exception alerts, and customer-facing tracking deflect WISMO volume before it hits support teams.
Post-peak analytics
Operational data translates into carrier performance scores, lane-level cost deviation reports, and demand forecast accuracy assessments.
Locus unifies all five areas within a single orchestration layer, eliminating the integration tax of running separate point systems, each with its own data model, alert logic, and reporting interface.
AI-native logistics architecture shifts peak season from a capacity crisis to a configuration adjustment because the system scales dispatch intelligence without proportional headcount increases.
Revamp Your Approach to Peak Season Logistics
Peak season logistics failure is an orchestration problem. Supply chains absorbing 4x order volume without proportional cost increases run on AI-driven dispatch, continuous route optimization, and real-time visibility, using peak-execution data to improve the next cycle.
Locus’s orchestration layer brings these capabilities into a single coordinated system, making peak season a structural test that enterprise operations teams pass by design.
To learn more, get a demo now.
Frequently Asked Questions
1. How far in advance should enterprise e-commerce teams begin peak season logistics planning?
Planning for Black Friday and December holidays should begin in late Q1 for carrier negotiations and network design, and by July for inventory pre-positioning and 3PL capacity agreements. Chinese New Year preparation requires procurement decisions in October and November of the prior year, given the 8–10 week factory shutdown effect on replenishment lead times.
2. What role does AI-powered demand forecasting play in reducing stockouts and overstock during peak periods?
AI demand forecasting at the SKU-location-day level ingests real-time order signals, promotional calendars, and regional consumption patterns to generate continuously updated inventory requirements. Legacy average-based models fail at peak because demand curves are non-linear and promotional cannibalization shifts volume between SKUs in ways historical data cannot anticipate.
3. How can multi-carrier dispatch automation reduce shipping costs during holiday surges?
Automated allocation across pre-negotiated carrier pools routes each shipment to the lowest-cost carrier meeting SLA requirements at dispatch, rather than defaulting to a preferred carrier whose rates spike first. Enterprise teams using this model see peak-season shipping cost overruns drop by 15–25%.
4. What metrics should logistics leaders track during and after peak season to improve future performance?
Cost-per-delivery deviation from plan by lane and carrier, SLA compliance at the lane level, demand forecast accuracy by region and day, WISMO inquiry volume by carrier, and return rate correlation with delivery speed. Each maps to a specific operational decision, whether carrier renegotiation, network redesign, or demand model recalibration.
5. How does real-time route optimization differ from static route planning during peak delivery volumes?
Static routes are planned once per shift, typically before drivers depart. Real-time route optimization recalculates delivery sequences continuously as new orders arrive, traffic conditions change, and driver status updates come in. When a driver falls behind, the system recalculates downstream stops to absorb the deviation rather than carrying the deficit forward.
General
Real-Time Delivery Tracking: What Customers Expect and How to Deliver It
Apr 8, 2026
Learn how real-time delivery tracking improves customer experience, reduces WISMO tickets, and boosts delivery success with live visibility and dynamic ETAs.
Read more
General
OTIF in Retail Logistics: What It Measures, Why It Fails, and How AI-Driven Orchestration Fixes It
Apr 9, 2026
Learn how enterprise retailers achieve 98%+ OTIF with AI-powered dispatch, route optimization, and real-time visibility. Strategies, benchmarks and tech inside.
Read moreInsights Worth Your Time


How Enterprise E-Commerce Teams Win Peak Season Logistics Without Operational Breakdown