General
OTIF in Retail Logistics: What It Measures, Why It Fails, and How AI-Driven Orchestration Fixes It

Key Takeaways
- OTIF (on-time, in-full) is now the primary accountability metric in retail supplier relationships, with major retailers enforcing 98%+ thresholds and applying chargebacks on every miss.
- Enterprise OTIF failures trace to systemic orchestration gaps across siloed OMS, ERP, and TMS systems, making point-solution fixes ineffective against the root cause.
- AI-powered logistics orchestration addresses the four specific failure points in retail fulfillment: demand positioning, route computation, dispatch assignment, and real-time exception handling.
- The compounded cost of OTIF misses, including chargebacks, expedited re-shipments, eroded order volumes, and consumer brand losses, far exceeds the visible penalty line on any chargeback report.
- Seasonal demand surges and external supply chain disruptions are where static planning tools fail most visibly and where AI orchestration delivers disproportionate returns.
Post 2020, enterprise retailers enforce OTIF retail logistics standards of 98% or higher, and the average supplier falls short by enough to absorb a chargeback line growing quarterly.
Most logistics teams respond with operational adjustments, including additional safety stock, revised carrier agreements, and tighter dispatch windows. Despite this, the gap persists.
OTIF failures at enterprise scale trace back to disconnected systems, forecasting blind spots, and a last-mile execution layer lacking the intelligence to prevent misses before they occur. Fragmented tools and reactive workflows were never designed for the velocity and variability of modern retail fulfillment.
In this guide, we develop a concrete improvement framework covering the structural failure modes driving persistent underperformance. We also focus on the specific AI mechanisms closing each gap.
What OTIF Means in Retail Logistics: Why the Bar Keeps Rising
Few compliance standards in retail logistics carry as immediate a financial consequence as OTIF. It is the product of two independent requirements, and failing either one fails the whole score.
What the metric measures
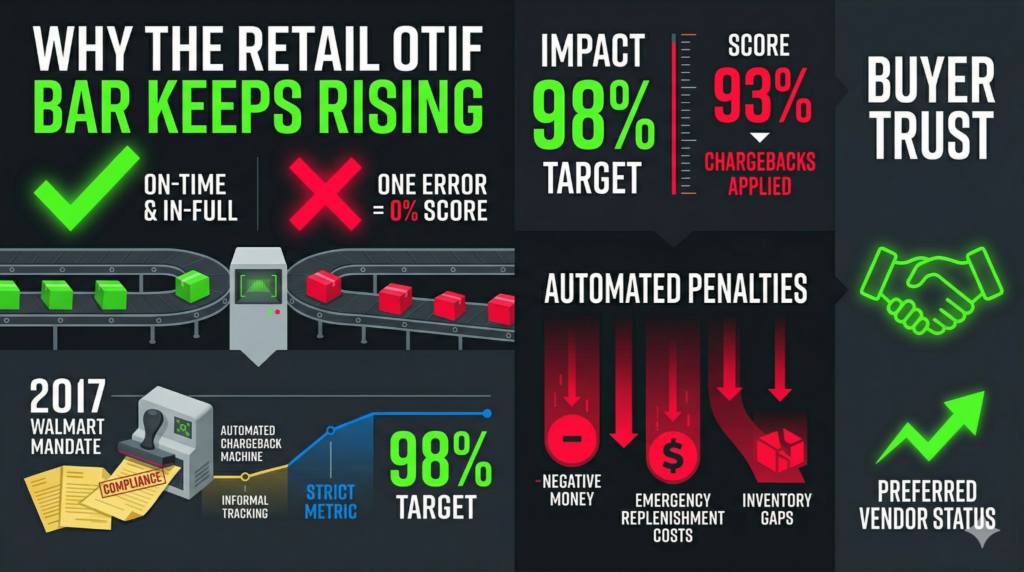
OTIF measures two dimensions of delivery performance simultaneously. An order must arrive on time and arrive complete for the score to count. A shipment landing a day early but with 85% of ordered units still fails OTIF. A fully complete order missing the delivery window by 12 hours still fails OTIF.
The Walmart mandate
Walmart’s 2017 OTIF mandate changed the metric’s meaning for supplier operations. Before the mandate, OTIF was tracked internally by most retailers as a planning metric with informal accountability. Walmart codified it as a supplier compliance standard with financial penalties for any score below 75%, later tightened to 98%, and backed it with an automated chargeback system. Other major retailers followed.
A supplier missing OTIF at scale creates inventory gaps on retail shelves, triggers emergency replenishment at premium cost, and erodes the retailer’s ability to commit to consumer-facing availability. The chargeback transfers part of that cost back to the supplier.
OTIF as a strategic differentiator
Beyond financial penalties, consistent OTIF performance drives buyer-supplier relationship health. Retailers allocate shelf space, promotional support, and preferred vendor status partly on fulfillment reliability.
A supplier running at 93% OTIF is paying chargebacks and competing at a disadvantage for the next replenishment cycle simultaneously. For enterprise suppliers shipping across multiple retail accounts, each with its own measurement window and chargeback schedule, the aggregate exposure is material well beyond individual invoice deductions.
How OTIF Is Calculated: What the Metrics Actually Tell You
Getting the OTIF formula right is the easy part. Getting the measurement granularity right is where most enterprise operations fall short, and where the difference between a diagnostic metric and a strategic tool becomes clear.
The OTIF formula and what a miss actually costs
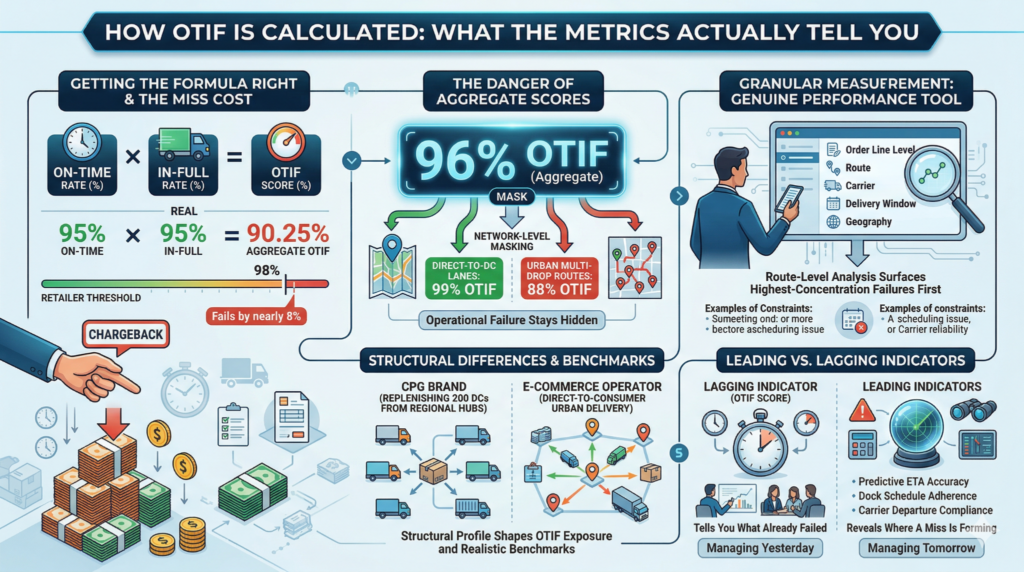
OTIF calculates by multiplying on-time delivery rate against in-full delivery rate. A shipment scoring 95% on-time and 95% in-full produces an aggregate OTIF score of 90.25%. At a retailer requiring 98%, the combination fails by nearly eight percentage points, triggering a chargeback on the full order value.
Why aggregate scores hide the real failures
Granularity of measurement determines how useful OTIF functions as a diagnostic tool. Aggregate OTIF scores, averaged across all orders or all accounts, mask where the system actually breaks.
A retailer running 96% OTIF at the network level may be running 88% OTIF on urban multi-drop routes and 99% on direct-to-DC lanes. The aggregate number passes. The operational failure stays hidden.
Enterprise logistics leaders who use OTIF as a genuine performance tool measure it at the order line level, by route, by carrier, by delivery window, and by geography. Route-level analysis surfaces the highest-concentration failures first, because a single scheduling constraint or carrier reliability issue compounds across every order on the route for weeks before appearing in network-wide data.
How supply chain network design shapes fulfillment architecture also determines which OTIF benchmarks are realistic for different retail verticals. A CPG brand replenishing 200 store DCs from regional hubs has a structurally different OTIF exposure profile than an e-commerce operator running direct-to-consumer urban delivery.
Leading indicators versus lagging scores
As a lagging indicator, OTIF score tells you what already failed. Leading indicators, including predictive ETA accuracy, dock schedule adherence rates, and carrier departure compliance, reveal where a miss is forming before it registers. Logistics teams operating only off OTIF score are managing yesterday’s performance.
Why Enterprise Retailers Consistently Fail OTIF Targets
Five structural failure modes drive enterprise OTIF gaps, each compounding the others.
Siloed systems and data blind spots
Siloed systems are the first and most consistent failure driver. Most enterprise retailers run OMS, ERP, and TMS on separate platforms with asynchronous data exchange.
When inventory data in the OMS reflects yesterday’s warehouse state and the TMS is planning routes against an outdated order list, the route is optimized for a version of reality no longer in place. Delivery windows get assigned based on inventory yet to arrive.
Demand forecasting errors and in-full failures
Demand forecasting errors compound the siloed data problem. When forecasting models miss a regional demand spike by 15%, the shortfall cascades into partial-fill shipments.
A partial shipment is an automatic in-full failure regardless of transport execution quality. Most improvement programs address transport first, but to achieve last-mile excellence, the in-full failure must be addressed upstream.
Dock scheduling and carrier coordination failures
Dock scheduling and carrier coordination introduce a third failure layer. Enterprise retailers receive shipments across multiple DCs, each with carrier check-in windows, dock capacity limits, and unloading time allocations.
When a carrier misses its assigned dock window, the shipment queues and delivery confirmation slips past the OTIF time threshold, even when the freight arrives on schedule.
Last-mile variability in multi-drop routes
Last-mile variability concentrates in urban and multi-drop retail routes. A single delay early in a multi-stop sequence, a failed access attempt at a back-of-house receiving dock, or a consignee absent during a delivery window cascades across every subsequent stop. The driver cannot recover without rerouting, and rerouting requires a dispatcher call, consuming time neither party has.
Real-time exception management gaps
The inability to manage delivery exceptions in real time is the final structural gap. When an exception arises mid-route, most operations rely on manual resolution between the driver and the dispatcher. Manual exception handling adds 15 to 20 minutes per incident, during which the sequence has already shifted, and the OTIF clock is still running.
The Cost of Poor OTIF Beyond Chargebacks
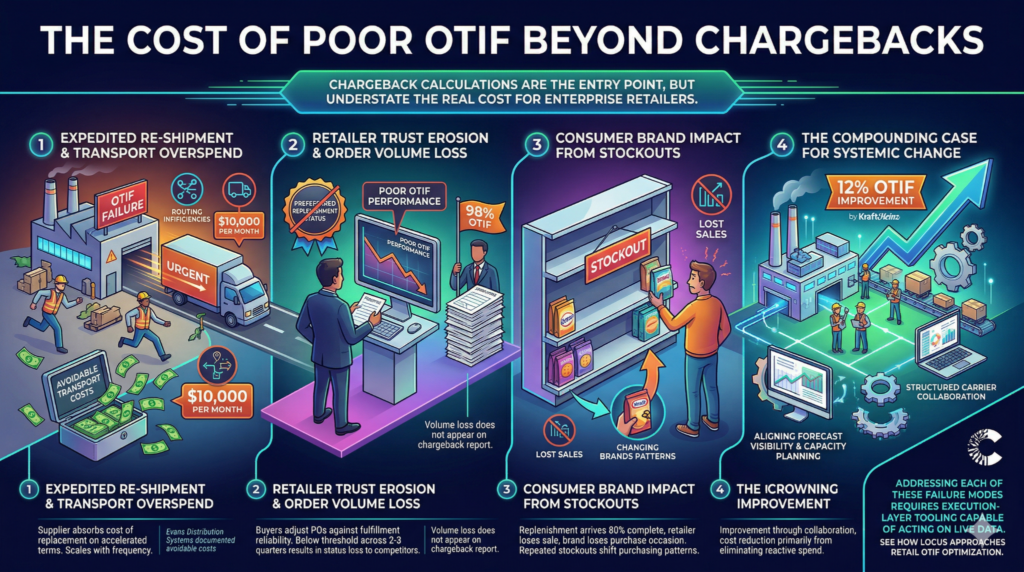
Chargeback calculations are the entry point for quantifying OTIF failure, but they understate the real cost for enterprise retailers.
Expedited re-shipment and transportation overspend
Expedited re-shipment is the most direct non-chargeback cost. When an order fails OTIF, the supplier absorbs the cost of getting replacement inventory to the retailer on accelerated terms.
Evans Distribution Systems documented $10,000 per month in avoidable transportation costs from data gaps, causing routing inefficiencies and OTIF failures. At enterprise shipping volumes, the figure scales with the frequency of misses.
Retailer trust erosion and order volume loss
Retailer trust erosion is harder to quantify but more consequential. Buyers track OTIF performance across supplier portfolios and adjust purchase orders against fulfillment reliability. A supplier running below threshold across two or three consecutive quarters loses preferred replenishment status, ceding volume to a competitor hitting 98%+. Lost volume does not appear on a chargeback report.
Consumer brand impact from stockouts
Stockouts caused by in-full OTIF failures carry a separate consumer-facing cost. When a shelf runs empty because a replenishment shipment arrived 80% complete, the retailer loses a sale, and the brand loses a purchase occasion. Repeated stockouts shift purchasing patterns in ways that the originating logistics failure rarely traces back to.
The compounding case for systemic change
Kraft Heinz reported a 12% OTIF improvement through structured carrier collaboration, aligning forecast visibility with carrier capacity planning, with cost reduction coming primarily from eliminating reactive spend.
Addressing each of these failure modes requires execution-layer tooling capable of acting on live data. See how Locus approaches retail OTIF optimization before reviewing the specific mechanisms below.
How AI-Powered Logistics Orchestration Drives 98%+ OTIF
Static route planning tools and manual dispatch workflows were designed for predictable, low-variability operations. The multi-retailer, multi-DC fulfillment environments where OTIF failures concentrate are neither.
Predictive demand alignment
The in-full failure mode begins upstream, in the gap between actual demand and inventory positioning. AI-driven demand alignment uses real-time demand signals and event-based triggers to recommend positioning decisions before a replenishment cycle is committed.
When inventory is positioned against predicted demand rather than last week’s order data, partial-fill shipments drop. AI-enabled supply chain operations have documented a 96% reduction in stockouts alongside a 50% reduction in operating costs, according to McKinsey research on AI in supply chains.
Dynamic route optimization
On-time failures in urban multi-drop routes trace directly to the limits of manual planning. Optimizing a 30-stop route across vehicle capacity, delivery windows, traffic state, driver hours, and retailer-specific dock requirements is a computational problem no dispatcher solves manually in the time available.
Locus’s DispatchIQ engine runs this AI route optimization across 250+ variables simultaneously, compared to 20 to 30 for most competing tools. When a mid-route event triggers a change, the engine recomputes the remaining sequence and pushes the updated route to the driver without dispatcher input.
Intelligent dispatch assignment
Route optimization determines the sequence. Dispatch assignment determines which driver and vehicle execute it. These are separate decisions with separate failure modes.
When dispatch assignment runs on static rules, typically seniority or zone assignment, the system cannot account for a driver already running behind on an adjacent route, a vehicle with a maintenance flag, or a carrier showing a 14% late-arrival rate on a specific lane.
Locus’s dispatch engine assigns orders to drivers against real-time constraints, including vehicle capacity, delivery windows, driver proximity, live traffic, and SLA commitments. The assignment updates dynamically as conditions change throughout the dispatch cycle.
Real-time visibility and proactive exception handling
Manual exception handling, the final structural gap, is where passive tracking tools fail entirely. They show where a vehicle is. They do not act on what they surface.
Locus’s Control Tower module generates predictive SLA breach alerts 15 to 30 minutes before a delivery falls at risk, giving dispatchers and automated workflows time to reroute, reallocate, or notify the consignee before the OTIF window closes. Exceptions are flagged and resolved before they register as score drops.
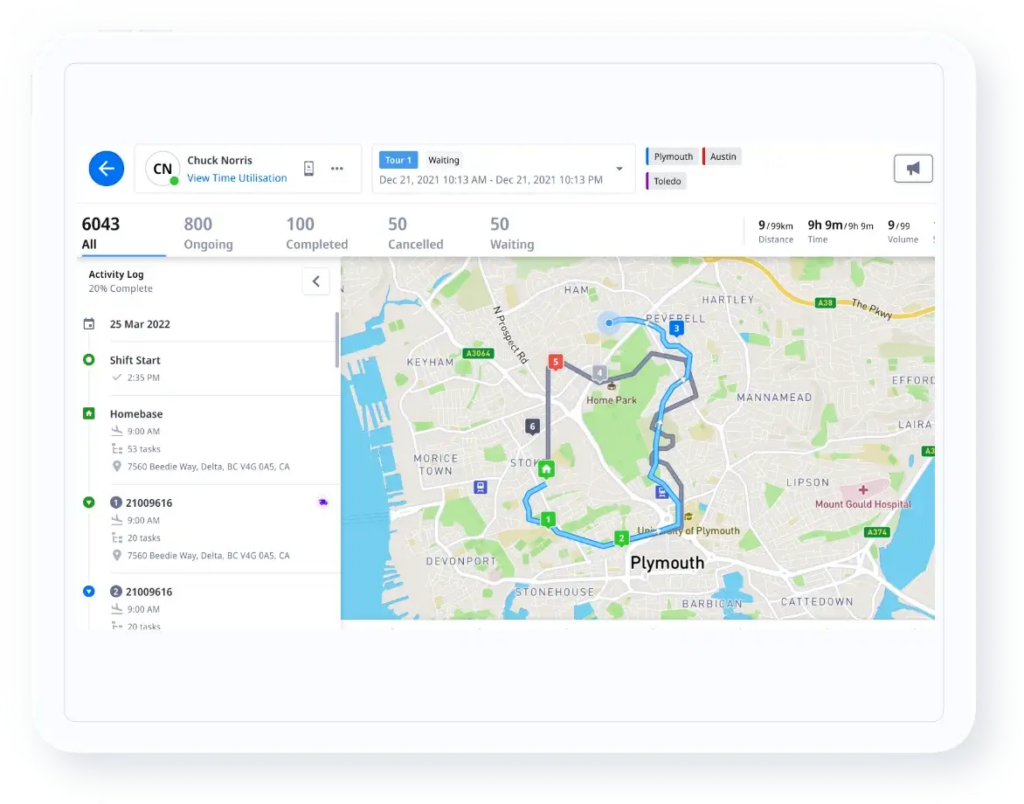
At scale across 400+ cities and using last-mile technology built for enterprise density, Locus maintains 99.5% on-time delivery for operations running on the system.
Building an OTIF Improvement Roadmap for Retail Operations
| Phase | Strategic Objective | Key Actions | Expected Outcome |
|---|---|---|---|
| Phase 1: Measurement | Granular Performance Baseline | Analyze route-level, carrier-level, and DC-level OTIF breakdowns to find failure clusters. | Data-driven prioritization of operational changes rather than general assumptions. |
| Phase 2: Integration | Cross-Ecosystem Visibility | Integrate OMS, TMS, and DC operations to share real-time inventory and departure data. | A continuous data foundation that bridges the gap between warehouse and last-mile. |
| Phase 3: Deployment | Targeted AI Optimization | Apply AI-driven route and dispatch optimization to high-impact urban and carrier-specific lanes. | Immediate, measurable OTIF gains in the most problematic segments of the network. |
| Phase 4: Scaling | Continuous Improvement Loops | Use AI orchestration to track carrier trends and route deviations as leading indicators. | A self-correcting system where platform-level data prevents future failure cycles. |
Closing the gap between current OTIF performance and the 98%+ threshold requires a phased approach.
Phase 1: Measure OTIF at the right granularity
Start by measuring OTIF at the right granularity. Network-level OTIF averages hide where failures concentrate. Before any operational change, logistics teams should pull route-level, carrier-level, and DC-level OTIF breakdowns and identify the highest-frequency failure points. Improvement priority should follow the data rather than general assumptions about where the problem lives.
Phase 2: Integrate visibility across warehouse, transport, and last mile
Step two is closing the visibility gap across warehouse, transport, and last-mile systems. Enhanced retail logistics visibility across these three layers makes the data aggregation in step one possible on a continuous basis. An OMS sharing real-time inventory state with a TMS, and a TMS sharing carrier departure data with DC operations, creates the data foundation for everything downstream.
Phase 3: Deploy AI-driven route and dispatch optimization
Deploying AI-driven route and dispatch optimization against the highest-impact failure points first is step three. For most enterprise retailers, those are urban multi-drop routes and carrier-specific lanes with documented late-delivery patterns. Automated route planning applied to these specific segments produces measurable OTIF improvement without requiring a full-network rollout in the initial phase.
Phase 4: Build continuous improvement loops
Step four is establishing a continuous improvement loop using real-time performance data. Operational intelligence generated by AI orchestration, including carrier performance trends, route-level deviation patterns, and exception frequency by DC, creates the leading indicators needed to prevent the next cycle of failures. Platform-level orchestration is the binding requirement. Point tools applied sequentially do not compound.
Future-Proofing OTIF Against Seasonal Peaks and Supply Chain Disruptions
Two conditions routinely break the assumptions baked into any OTIF improvement program.
Managing seasonal demand spikes and promotional surges
Demand spikes during Q4 holiday periods, promotional surges, and flash sale events push order volumes well beyond the calibrated baseline. Static planning tools handle this by pre-building larger route tables.
When actual volumes exceed the pre-built plan by 20%, route sequences fail, carrier coverage gaps appear, and OTIF scores drop across accounts previously performing above threshold.
Locus’s Capacity Management module handles peak scenarios by running demand forecasts at daily, weekly, and seasonal intervals with event-based triggers for promotional periods.
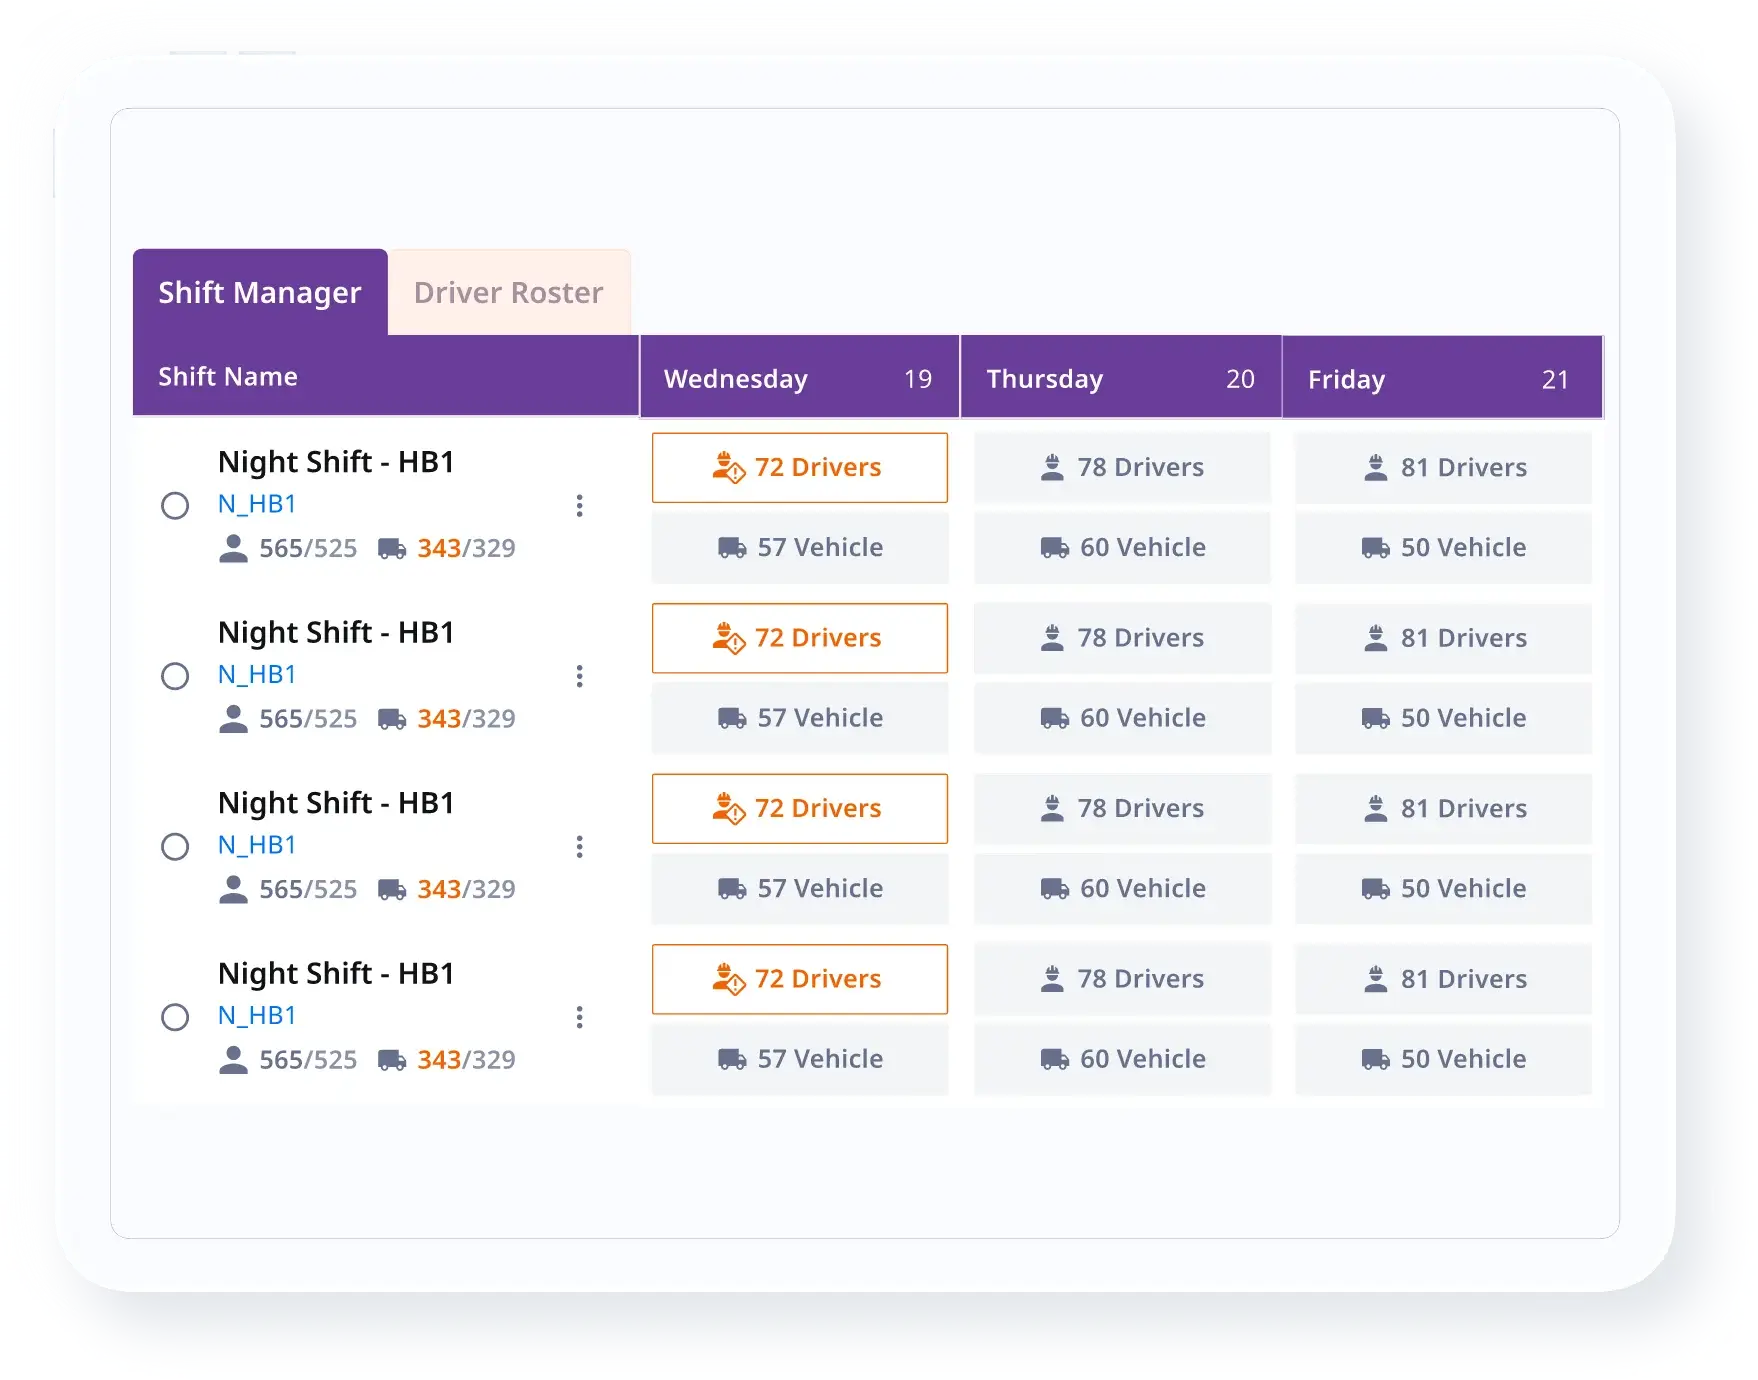
Fleet and driver resources are scheduled against predicted volume, with part-time driver activation and carrier overflow capacity triggered automatically when the forecast signals a gap.
Maintaining OTIF through external supply chain disruptions
External disruptions, port delays, carrier capacity contractions, and weather events present a different challenge. Forecasting accuracy alone cannot address a disruption already in motion.
Locus’s real-time rerouting and carrier bidding system lets logistics teams switch carrier assignments, resequence pending routes, and reallocate orders to backup carriers in real time, rather than managing the disruption through individual dispatcher calls across a network under simultaneous pressure.
The teams reinventing the last mile for long-term OTIF resilience treat disruption response as a designed capability embedded in the platform architecture.
Achieve 98%+ OTIF With AI-Powered Dispatch
Reaching 98%+ OTIF requires a unified execution layer addressing demand positioning, route quality, dispatch assignment, and exception handling simultaneously.
Locus’s logistics orchestration system gives retail and FMCG operations exactly that. Schedule a Locus demo to see how AI-driven dispatch moves your retail OTIF from current performance to 98%+.
Frequently Asked Questions (FAQs)
1. What is a good OTIF score for enterprise retail logistics, and how do top performers benchmark?
Major retailers including Walmart enforce 98%+ OTIF thresholds as a hard supplier compliance standard. Top-performing enterprise suppliers sustain scores above this threshold by building predictive visibility and AI-driven dispatch into their fulfillment stack. A score below 95% typically triggers active review and risks reduced order volumes.
2. How does AI-powered route optimization directly improve OTIF rates in multi-drop delivery scenarios?
AI route optimization improves OTIF by computing multi-stop sequences across delivery windows, vehicle capacity, live traffic, and carrier constraints simultaneously. In multi-drop urban scenarios, a single early delay cascades across the full sequence if the route holds. Locus’s DispatchIQ reoptimizes the remaining sequence in real time across 250+ variables, pushing updates to drivers without dispatcher involvement.
3. What is the difference between measuring OTIF at the order level versus the line-item level?
Order-level OTIF treats each shipment as a single pass-or-fail score. Line-item OTIF measures each SKU separately, catching partial-fill failures at a granular level and producing more accurate diagnostics for identifying which categories or suppliers are driving in-full failures.
4. How can retailers maintain high OTIF performance during seasonal demand surges?
Maintaining OTIF during demand surges requires dynamic capacity planning. Pre-built route tables scaled upward cannot adapt when the actual volume diverges from the estimate by 20% or more. AI-driven forecasting anticipates volume spikes, triggers carrier overflow capacity automatically, and reschedules fleet resources against predicted peaks.
5. What role does real-time supply chain visibility play in reducing OTIF-related chargebacks?
Real-time visibility at the shipment level allows logistics teams to resolve OTIF-threatening exceptions before the delivery window closes. Predictive alerts give dispatchers time to reroute or notify the receiving DC when a carrier is running late against a hard dock window. Exceptions caught before the OTIF window closes do not become chargebacks.

General
How Enterprise E-Commerce Teams Win Peak Season Logistics Without Operational Breakdown
Apr 9, 2026
Learn how enterprise e-commerce teams use AI dispatch, demand forecasting, and route optimization to scale peak season logistics without breaking operations.
Read more
General
Reduce Logistics Costs with AI: Why Fragmented Deployment Leaves Most Savings on the Table
Apr 9, 2026
Most AI logistics deployments fail to deliver real savings. Learn why fragmented tools cap ROI and how end-to-end orchestration unlocks 20%+ cost reduction.
Read moreInsights Worth Your Time


OTIF in Retail Logistics: What It Measures, Why It Fails, and How AI-Driven Orchestration Fixes It