Last Mile Delivery
Last Mile Delivery Optimization: How Enterprises Cut Costs and Scale Fulfillment
Key Takeaways
- Last mile delivery accounts for 41% of total supply chain costs, yet most enterprises are still running it on static routing, manual dispatch, and fragmented visibility across carrier systems
- AI-driven route optimization reduces delivery times by 15 to 20% and increases stops per route per hour by 30%, compressing cost per delivery without adding fleet or headcount
- Last mile optimization as a point solution hits a ceiling. The ROI inflection point comes when routing, dispatch, visibility, customer communication, and analytics operate under unified AI orchestration
- Locus powers last mile delivery optimization for enterprises across retail, FMCG, e-commerce, 3PL, and CPG, across 30+ countries
Last mile delivery represents the single largest cost center in the supply chain, accounting for 41% of total logistics spend, and most enterprises are still running it on infrastructure designed for a simpler era.
Static routing tools, manual dispatch workflows, and carrier visibility that requires three separate portals to reconcile are the operational baseline for logistics teams managing tens of thousands of daily deliveries.
This article breaks down AI-powered strategies, automation frameworks, and measurement systems for last-mile delivery optimization. It draws on Locus’s experience orchestrating millions of deliveries across 30+ countries.
Why Last Mile Delivery Consumes Nearly Half of Total Supply Chain Costs
The 41% figure is widely cited. What is less often examined is where that cost actually bleeds in enterprise operations. The structural causes are specific, and understanding them is the prerequisite for knowing which optimization investments produce the most return.
| Cost driver | How it accumulates | Enterprise scale impact |
|---|---|---|
| Fleet underutilization | Vehicles dispatched with incomplete loads because static planning cannot consolidate orders across overlapping service zones in real time. | Each percentage point of trailer fill rate below 80% represents direct margin loss on every run. At 200 vehicles, this compounds daily. |
| Failed first-attempt deliveries | Wrong ETAs, absent customers, and inaccessible locations drive re-attempt costs that static routing tools cannot prevent because they do not adapt to real-time conditions. | At $17.20 per failed attempt and a 3% miss rate across 10,000 daily deliveries, that is $5,160 in daily avoidable spend. |
| Manual dispatch overhead | Dispatchers spend two to three hours per shift building route plans manually from order data that may already be outdated at the moment of planning. | Every hour of planning delay is an hour of idle fleet capacity. At peak season, this bottleneck does not scale regardless of how many dispatchers are added. |
| Idle driver time | Suboptimal stop sequencing, unplanned wait times at delivery locations, and poor workload distribution across drivers create idle time that is paid but unproductive. | Driver labor represents 25-35% of last mile operating costs. Idle time reduction through better sequencing is the fastest path to cost-per-delivery improvement. |
| Fragmented carrier visibility | Operations teams reconcile delivery status across owned fleet tracking, 3PL portals, and carrier apps manually. Exceptions are discovered after they cause failures, not before. | Each exception found reactively generates a customer escalation, a re-delivery cost, and potential SLA penalty. The cost is not the exception itself but the delay in detecting it. |
The Core Challenges Holding Enterprise Last Mile Operations Back
Enterprise last mile operations face a different category of challenge than small-fleet or mid-market delivery. The volume and complexity interact: a problem that a dispatcher resolves in 10 minutes at 200 daily orders becomes a systemic bottleneck at 20,000.
Five operational constraints define where most enterprise operations are currently constrained.
Static route planning in a dynamic environment
A route plan built at 6 AM using yesterday’s traffic patterns, this morning’s order list, and forecast weather data is already degrading before the first vehicle leaves the depot. Order cancellations, traffic incidents, vehicle breakdowns, and priority escalations accumulate throughout the shift.
Static planning tools respond to each event as a manual exception. The compounding effect is dispatchers spending more time managing today’s failures than planning tomorrow’s routes.
Cross-fleet visibility gaps
Most enterprise operations run owned fleet and contracted 3PL partners simultaneously, sometimes alongside gig driver networks. Each relationship has its own tracking system.
When a 3PL vehicle goes off-route or misses a milestone, operations finds out when the carrier calls or the customer complains. The visibility gap between fleet types is where the highest-cost exceptions hide, and it is where the gap between basic tracking and operational control is most apparent.
Manual dispatch that cannot scale during peak volume
Retail peak seasons, FMCG replenishment surges, and e-commerce promotional events create order volume spikes of 3x to 10x above daily averages. Manual dispatch workflows that work adequately at average volume fail at these spikes because the coordination work scales linearly with order count while dispatcher capacity does not.
The enterprises that navigate peak season without SLA degradation are the ones whose dispatch layer is automated enough to absorb the volume without adding temporary staff.
Fragmented data across logistics systems
TMS, WMS, and delivery management systems each hold a slice of the operational picture. When they do not share live data, dispatch decisions are built on incomplete information: vehicle capacity that does not reflect the last WMS update, order priorities that have not propagated from the OMS, carrier capacity that was available when planning started but is committed by the time assignments execute.
Each data gap produces a suboptimal allocation that would not survive scrutiny if all the relevant context were visible at the moment of decision.
How AI-Powered Route Optimization Transforms Last Mile Efficiency
The operational gap between legacy routing and AI-driven multi-constraint optimization is the gap between a plan that is mathematically optimal on paper and one that holds up under real-world conditions throughout an entire delivery shift.
What multi-constraint optimization processes simultaneously
- Delivery time windows at customer and depot level, enforced as hard constraints rather than advisory preferences
- Vehicle capacity by payload weight, volume, and cargo type compatibility across a heterogeneous fleet
- Driver shift hours, certification requirements, and historical performance on specific route types
- Live traffic conditions updated continuously, not assumed from morning data
- District-level workload distribution that prevents one delivery zone from absorbing disproportionate volume while adjacent zones run underloaded
The district-level dimension is where AI route optimization produces outcomes that route-level optimization alone cannot reach.
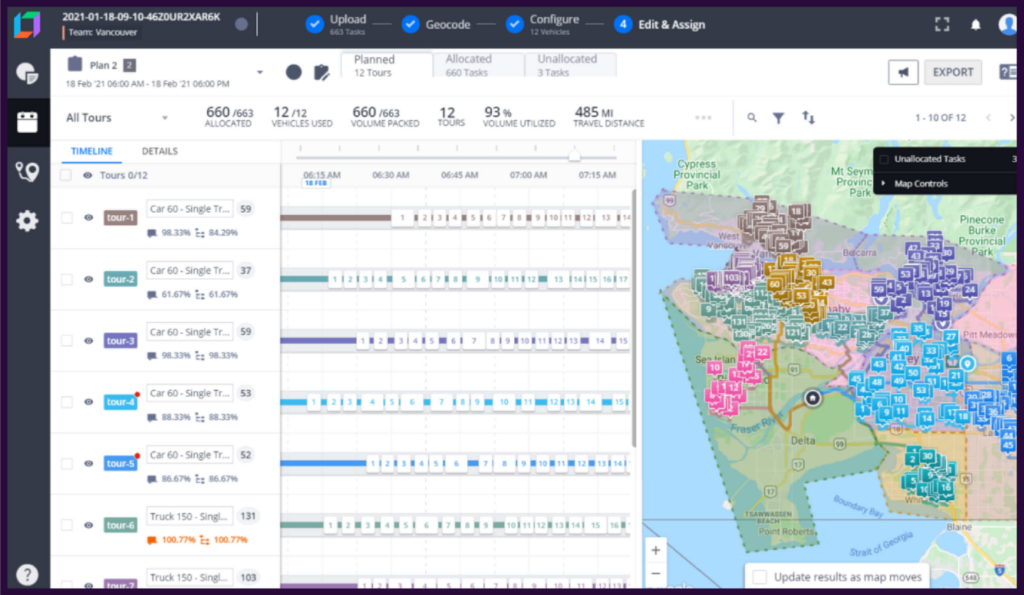
DispatchIQ, Locus’s dispatch engine segments delivery zones dynamically, balances driver workloads across them, and sequences stops across thousands of orders simultaneously. The result is routes that complete 15-20% faster than static plans because the workload is distributed correctly before the sequencing begins.
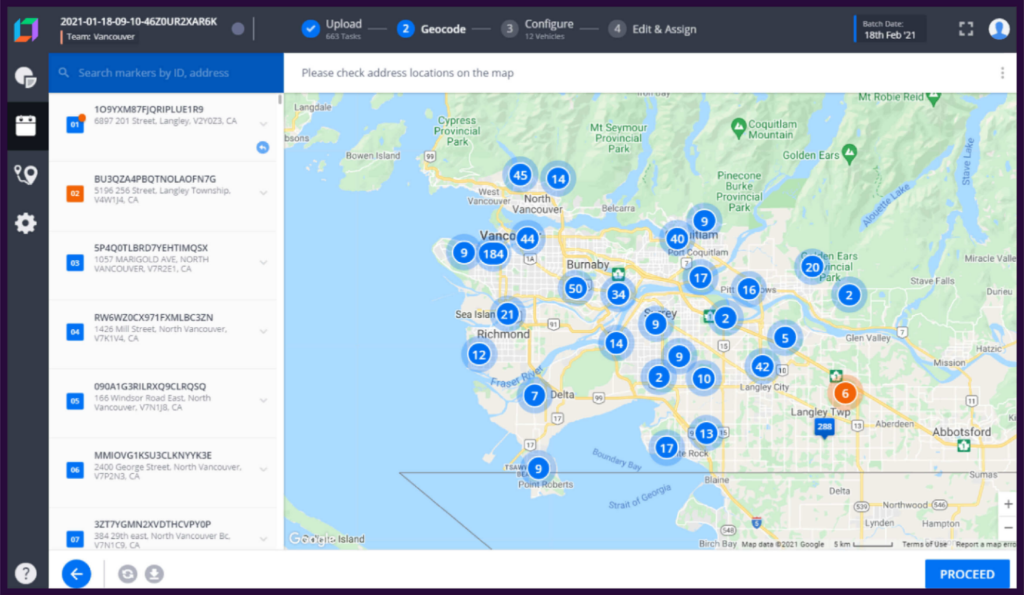
Geocoding accuracy and delivery success rates
In markets with non-standardized address infrastructure (India, Southeast Asia, the Middle East), geocoding failure is the upstream cause of a significant share of failed delivery attempts.
An AI routing engine trained on millions of delivery attempts learns to resolve ambiguous and incomplete addresses that rules-based geocoders fail on, reducing failed attempts at the address resolution stage before a driver ever reaches the location.
Automated Dispatch and Real-Time Visibility as Force Multipliers
Route optimization determines the plan. Automated dispatch determines whether that plan reaches the right driver, in the right vehicle, with the right information, without a dispatcher manually approving each assignment.
The two capabilities compound: the best route plan is wasted if it is allocated to a driver whose vehicle cannot handle the load or whose shift ends before the route completes.
How automated dispatch removes the allocation bottleneck
Locus’s DispatchIQ assigns orders to drivers based on vehicle capacity, shift availability, driver certification, proximity, and SLA priority simultaneously. When dispatch is automated at this fidelity, the throughput improvement is measurable: automated dynamic dispatch enables 30% more packages per hour compared to manual allocation, moving the operational baseline from 10 stops per hour to 13.
Automated route planning at that level of constraint-awareness produces dispatch plans that hold up throughout the shift.
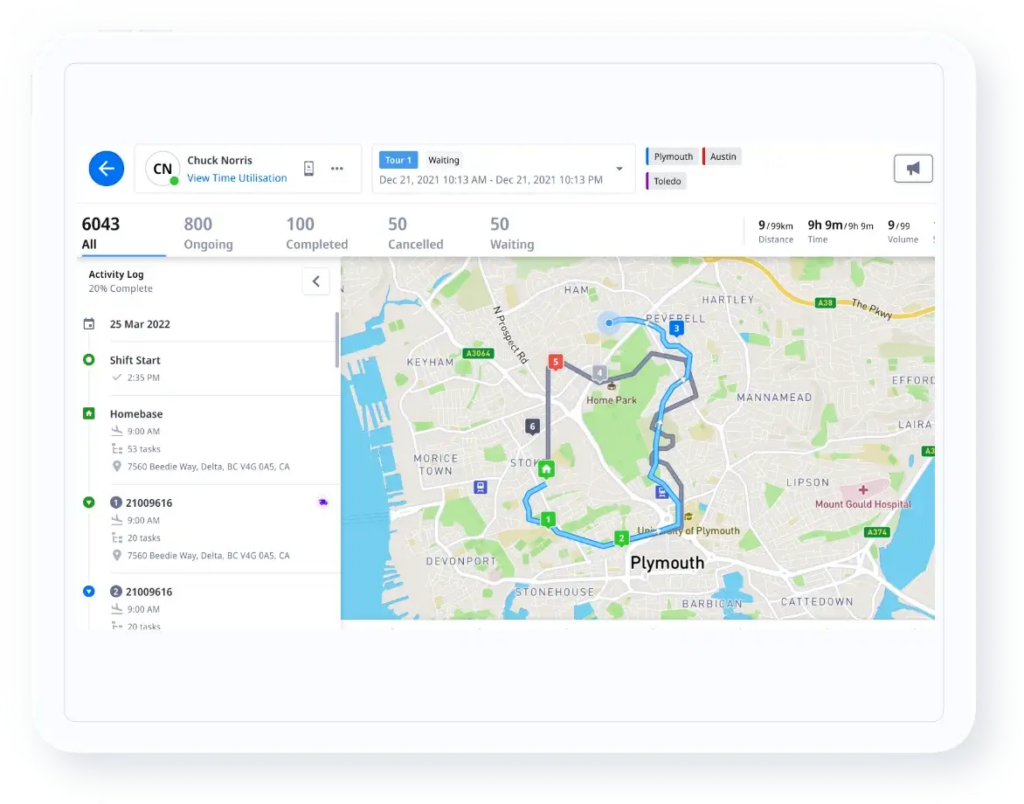
What real-time visibility actually means operationally
Real-time visibility in last mile optimization is a control tower layer that connects vehicle position to delivery commitments, surfaces SLA risk before windows close, and normalizes tracking data from owned fleet and 3PL carriers into a single operational view.
Last mile tracking enables proactive exception management. When the visibility layer surfaces a delivery heading toward a missed window with 45 minutes of lead time, operations can reroute, reassign, or notify the customer before the failure occurs. When it fires an alert after the window closes, the only available response is an apology and a re-delivery cost.
Measuring What Matters: Last Mile Delivery Metrics for Enterprise Teams
Enterprise logistics teams track last mile metrics. Most track them monthly, in arrears, in dashboards that show what happened but not why. The metrics below are non-negotiable for any enterprise optimization program.
| Metric | What it measures | Enterprise benchmark |
|---|---|---|
| Cost per delivery | Total last mile logistics spend divided by completed deliveries. The primary financial efficiency metric. | Varies by vertical. Locus customers achieve 20% cost per delivery reduction through AI dispatch and dynamic re-optimization. |
| On-time delivery rate | Percentage of deliveries meeting committed SLA windows across all carriers and fleet types. | 99.5% for scheduled retail replenishment. 95%+ for same-day e-commerce. Below 90% generates customer escalations and carrier penalty exposure. |
| First-attempt delivery success rate | Percentage of deliveries completed without a re-attempt. Direct indicator of ETA accuracy and customer communication quality. | Best-in-class enterprise operations run at 95%+. |
| Vehicle utilization rate | Productive delivery hours as a percentage of total available vehicle hours. Low utilization signals capacity waste or poor load consolidation. | Locus customers achieve 45% improvement in fleet utilization through better stop clustering and order grouping. |
| Driver productivity (stops per route per hour) | Actual delivery stops completed per driver per hour, accounting for dwell time, sequence efficiency, and route adherence. | Automated dispatch moves the operational baseline from 10 to 13 stops per hour. Best-in-class operations push above 15 with optimized sequencing. |
| Carbon emissions per delivery | CO2 output per completed delivery, calculated from driven miles and fuel consumption data. ESG reporting requirement for EU enterprises. | Route optimization that reduces driven miles by 12 to 18% reduces carbon emissions proportionally. Locus deployments have offset 17 million-plus kilograms of CO2. |
See how Locus surfaces these metrics in real time across your delivery operation. Schedule a demo to see continuous improvement analytics against your specific fleet and delivery volumes.
Scaling Last Mile Optimization Across Retail, FMCG, and 3PL Operations
Last mile optimization strategies that work in one vertical do not transfer automatically to another. The dispatch logic, constraint model, and SLA structure for a 3PL managing multi-client fleet operations is architecturally different from what a same-day e-commerce operation needs.
Enterprises that buy horizontal platforms and configure them to their vertical spend more on implementation than they save in efficiency.
Retail
High-SKU variability, store-level delivery windows tied to receiving dock schedules, and omnichannel fulfillment flows (store replenishment, D2C, click-and-collect) running simultaneously define the retail TMS challenge.
The dispatch model has to hold delivery sequence constraints that reflect unloading logistics at each location type, not just geographic proximity. Returns routing and reverse logistics need to integrate into the forward dispatch model.
FMCG and CPG
High-frequency territory routes with 30-50 stops per vehicle per day, distributor network coordination, and beat optimization across dense urban and rural geographies require a planning model that understands territory structure as a hard constraint.
The optimization challenge is distributing workload equitably across drivers while maintaining sequence consistency that retail outlet staff expect.
Supply chain network design decisions for FMCG brands flow from the route-level performance data that a well-configured platform surfaces, making depot placement and distributor allocation data-driven.
3PL
Multi-client SLA management, client-level visibility separation, and dynamic workload rebalancing across accounts with different delivery profiles define the 3PL optimization challenge.
A platform designed for single-operator logistics will require significant customization to maintain the data isolation and SLA differentiation that 3PL clients require.
White-label tracking portals, per-client analytics, and automated billing reconciliation across client contracts are requirements that need to be native capabilities, not configuration projects.
Integration and deployment
Last mile optimization delivers full value only when it connects to the existing enterprise technology stack.
Locus integrates with ERP, WMS, TMS, and OMS systems through prebuilt connectors and an API-first architecture, avoiding the rip-and-replace friction that blocks most enterprise platform deployments.
Configurable business rules per market support the regulatory and operational variation across Locus’s 30+ country deployment footprint, from EU GDPR compliance to address resolution in low-infrastructure SEA and MEA markets.
From Optimization to Orchestration: The Enterprise Logistics Shift
Enterprises that treat last mile optimization as a set of independent improvements will hit a ceiling. Better routing without automated dispatch means plans that degrade when conditions change. Automated dispatch without real-time visibility means exceptions that surface too late to prevent.
Visibility without analytics means data that informs retrospective reviews but not real-time decisions. The ROI inflection point comes when routing, dispatch, visibility, customer communication, and analytics operate as a unified system under shared AI logic.
This is what distinguishes an orchestration platform from a feature toolkit. In a unified system, a traffic event at 10 AM triggers a route recalculation, which triggers a driver reassignment, which triggers a customer ETA update, which logs the exception for the analytics layer, all within minutes and without dispatcher involvement. The dispatcher sees the outcome. The AI handled the chain.
Achieving last mile excellence at enterprise scale requires this kind of closed-loop operation.
The trajectory of AI-driven logistics points toward predictive pre-positioning, where demand forecasts inform depot staging decisions the night before dispatch begins; toward autonomous delivery integration, where mixed human-and-autonomous fleets operate under a single dispatch model; and toward hyper-personalized delivery windows, where customers define delivery preferences that the orchestration layer holds as a planning constraint rather than a post-booking exception. Building an orchestration layer now is the infrastructure play for that trajectory.
Locus has powered over 1.5 billion deliveries across 30+ countries, delivering $320+ million in logistics cost savings for enterprises across retail, FMCG, e-commerce, 3PL, and CPG.
Schedule a demo to see how AI-powered last mile orchestration performs against your specific delivery volumes, carrier network, and SLA requirements.
Frequently Asked Questions (FAQs)
1. What is the difference between last mile delivery optimization and last mile delivery management?
Last mile delivery management covers the operational execution of the final delivery leg: assigning drivers, tracking shipments, capturing proof of delivery, and communicating with customers. Last mile delivery optimization is the intelligence layer that makes those execution decisions better: AI-driven route sequencing, automated dispatch allocation, predictive ETA generation, and continuous re-optimization when conditions change. Management describes the workflow. Optimization describes the logic that makes it efficient.
2. How does AI-powered route optimization reduce last mile delivery costs at enterprise scale?
AI route optimization reduces last mile costs through four mechanisms: better stop clustering that reduces driven miles per delivery by 12-18%, dynamic re-sequencing that eliminates the failed-attempt cost from routes built on outdated morning data, automated workload balancing across drivers that reduces idle time, and geocoding intelligence that resolves ambiguous addresses before they produce failed attempts. At enterprise scale, these mechanisms compound: a 2% improvement in first-attempt success rate across 10,000 daily deliveries is over $3,000 in daily cost reduction.
3. What metrics should logistics teams track to measure last mile delivery optimization success?
The three non-negotiable enterprise metrics are cost per delivery (the primary financial efficiency indicator), on-time delivery rate (the primary SLA compliance indicator, with 99.5% as the enterprise benchmark for scheduled delivery), and first-attempt delivery success rate (the primary indicator of ETA accuracy and customer communication quality). Secondary metrics that provide the diagnostic picture are vehicle utilization rate, driver productivity in stops per hour, and carbon emissions per delivery for Scope 3 ESG reporting. These metrics should update in real time.
4. How does automated dispatch improve delivery throughput compared to manual allocation?
Automated dynamic dispatch enables 30% more packages per hour compared to manual allocation, moving the operational baseline from 10 stops per hour to 13. The mechanism is simultaneous multi-constraint assignment: vehicle capacity, driver shift availability, certification requirements, proximity, and SLA priority are all processed at the moment of allocation rather than checked sequentially by a dispatcher working through a queue. At peak season, when manual dispatch creates its largest bottleneck, automated allocation absorbs the volume surge without adding coordinator headcount.
5. Can Locus integrate with existing ERP and WMS systems?
Locus connects to ERP, WMS, OMS, and TMS systems through prebuilt connectors and an API-first architecture. The critical integration points are real-time order data from the OMS (so dispatch plans reflect current order status, cancellations, and priorities), inventory availability from the WMS (so vehicle loading plans are accurate), and carrier API feeds for multi-carrier tracking normalization.
TMS Software
Enterprise TMS: The Capabilities That Matter at Scale
May 18, 2026
What separates an enterprise TMS from a basic transport tool? Explore the capabilities, AI-driven features, and ROI benchmarks modern logistics leaders demand.
Read more
General
Delivery-to-Installation Handoff: How US White-Glove Retailers Lose Customer Lifetime Value in the Two-Hour Gap
May 18, 2026
US white-glove retailers lose CLTV in the gap between delivery and installation. Why integrated crew-and-service architecture matters for furniture and appliance operations.
Read moreInsights Worth Your Time


Last Mile Delivery Optimization: How Enterprises Cut Costs and Scale Fulfillment