General
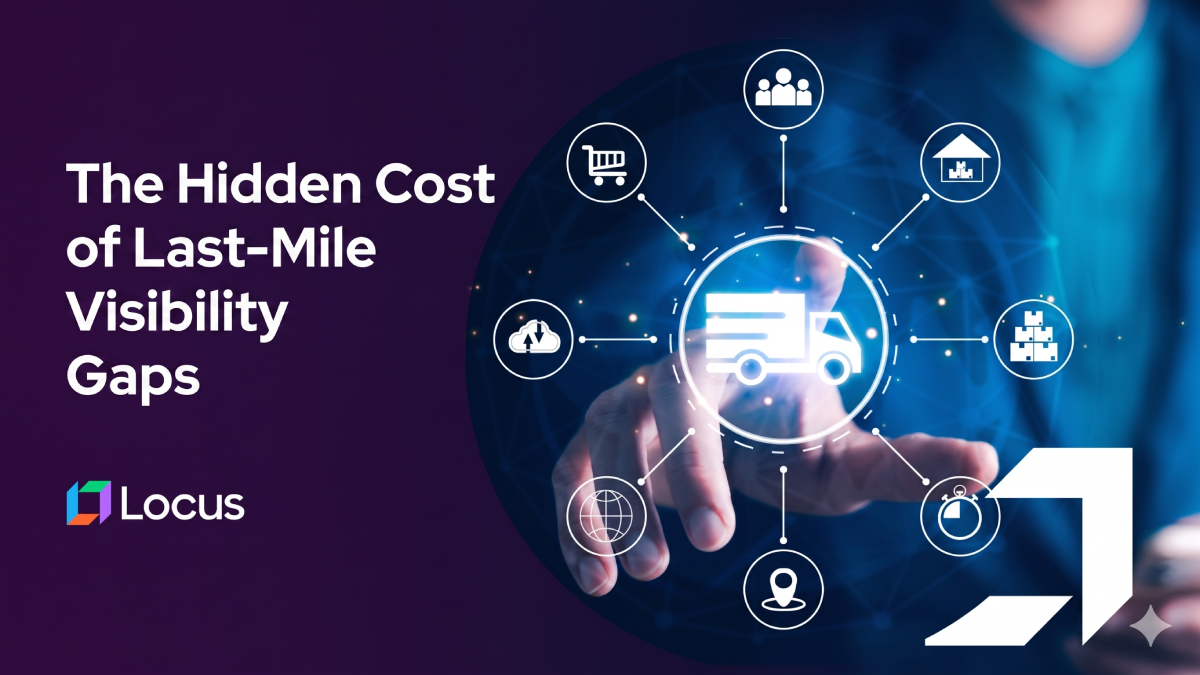
The Hidden Cost of Last-Mile Visibility Gaps: Why Tracking Alone Can’t Prevent Failed Deliveries
According to research, 90% of consumers now track their deliveries, with 39% checking daily. From the customer’s perspective, visibility is solved — they can see the dot on the map. But from the operations side, the picture is fundamentally different. According to Gartner, only 6% of supply chain leaders believe they have achieved full supply chain visibility. For enterprise logistics teams in retail, FMCG, e-commerce, 3PL, and CPG sectors across North America, Europe, Southeast Asia, India, and MEA, the gap between what customers can see and what operations can act on is where failed deliveries, cascading costs, and customer churn originate.
This is not a trivial disconnect. Last-mile delivery now accounts for 53% of total shipping costs, and the global last-mile delivery market is expected to reach USD 348.85 billion by 2033, expanding at a CAGR of 9.8%. As this market accelerates into 2026 and beyond, the visibility gap high-volume enterprises are struggling to close is not a lack of tracking data — it is a lack of predictive, actionable intelligence that can anticipate delivery failures before they happen and intervene in real time. According to The Last Mile Leaders (2025), visibility ranks as the second-highest pressure point at 13.5%, behind only cost (18.7%), underscoring that transparency and reliable SLAs are now table-stakes expectations across the last-mile delivery landscape.
The distinction matters because tracking tells you where a package is. Visibility, in its operational sense, tells you what is about to go wrong and enables the system to do something about it. Most last-mile technology stacks deliver the former but not the latter. The cost of that gap, at enterprise scale, reaches well into the millions.
Key Takeaways
- Tracking is not visibility. Most last-mile systems show where a package is. Predictive visibility anticipates where a delivery will fail and intervenes before it happens. Only 6% of supply chain leaders have achieved full visibility (Gartner). Visibility ranks as the second-highest pressure point (13.5%) for last-mile operators in 2026, behind only cost at 18.7% (The Last Mile Leaders, 2025).
- Visibility gaps create a cascading cost chain. Failed deliveries ($17.20/package — Loqate), WISMO calls (up to 50% of support volume — Narvar), and customer churn (32% leave after one bad experience — PwC) compound into millions annually for enterprise retail, FMCG, e-commerce, 3PL, and CPG operations.
- The gap has four structural layers. Data fragmentation across carriers, batch-processed status updates, reactive-only exception handling, and disconnected customer communication channels each create blind spots that tracking alone cannot close.
- Predictive visibility requires 180+ real-time constraints. Anticipating failures before they happen demands AI that processes traffic, weather, driver behaviour, delivery density, and customer availability simultaneously — far beyond package location tracking.
- The shift is from “where is it?” to “what will go wrong?” AI-native visibility platforms that predict, intervene, and reroute in real time have demonstrated 30–50% reductions in delivery disruptions (McKinsey). With last-mile delivery now accounting for 53% of total shipping costs, closing these gaps is a revenue-critical priority, not a logistics nicety.
Optimize Your Routes
Experience the efficiency of AI-powered route optimization with Locus.
The Anatomy of a Last-Mile Visibility Gap
Visibility gaps in high-volume last-mile operations are not a single problem. They are a stack of four structural blind spots, each of which compounds the others. Understanding this anatomy is the first step toward closing it.
The Four Layers of the Visibility Gap — At a Glance
| Layer | Blind Spot | Operational Impact |
| 1. Data Fragmentation | 50–200+ carriers with inconsistent tracking (GPS vs. status codes) | Mosaic of current and stale data; incomplete operational picture |
| 2. Batch-Processed Updates | 15–60 minute data lags on carrier status | System sees the past, not the present; failures register too late |
| 3. Reactive Exception Handling | Interventions triggered after failure, not before | Re-delivery costs, dispatcher bottlenecks, no predictive action |
| 4. Disconnected Customer Comms | No proactive notifications; WISMO calls spike | Up to 50% of support volume consumed by “Where is my order?” |
Layer 1: Data Fragmentation Across Carriers
High-volume retailers and 3PLs typically manage 50 to 200 or more carriers across regions, each with different tracking systems, data formats, update frequencies, and API capabilities. Some provide GPS-level precision every 30 seconds. Others provide status-code updates at three fixed checkpoints: picked up, in transit, and delivered. When your visibility is only as good as your least-capable carrier’s data feed, the operational picture is inherently incomplete. For every delivery being tracked in real time, there may be five more where the last status update was hours ago.
This fragmentation means the “real-time” dashboard that operations teams rely on is often a mosaic of current data and stale data stitched together — accurate enough to report on yesterday’s performance, but too incomplete to intervene on today’s failures before they happen. Carrier performance ranks as the third-highest pressure point (11.9%) for last-mile operators, directly tied to fragmented data quality across carrier networks.
Layer 2: Batch-Processed Status Updates
Many carrier integrations still operate on batch-processing cycles — status updates transmitted every 15, 30, or even 60 minutes. In last-mile delivery, where conditions change by the minute (traffic, weather, driver delays, customer availability), a 30-minute data lag means the system is always seeing the past, not the present. A delivery that will fail in 20 minutes shows as “on track” because the status data is 25 minutes old. By the time the failure registers in the system, it is already too late to reroute, reallocate, or notify the customer.
With on-time performance sitting at just 84% during peak season (project44, November 2024), the 16% failure window is largely a batch-lag problem — the system cannot act on data it hasn’t yet received.
Layer 3: Reactive Exception Handling
Most last-mile systems handle exceptions after they occur. A delivery fails, the system logs it, a dispatcher investigates, and a re-delivery is scheduled for the next day. The entire workflow is reactive — triggered by the failure itself, not by the signals that preceded it. Yet in most cases, the data signals that would predict the failure were available: the driver was running 40 minutes behind two stops earlier, traffic on the delivery corridor had doubled, the customer’s neighbourhood historically has a 25% failed-delivery rate in the afternoon. The signals existed. The system simply was not built to process them into a prediction and trigger an intervention.
Also Read: How to Reduce Failed Deliveries in Southeast Asia
Layer 4: Disconnected Customer Communication
According to Narvar’s consumer research, WISMO (“Where Is My Order?”) inquiries account for up to 50% of customer service contacts for some retailers. This is a direct symptom of the visibility gap — the customer cannot see reliable delivery timing, so they call. Proactive communication (real-time ETA updates, delay notifications, rescheduling options) could pre-empt the majority of these contacts. Research from project44 shows that proactive delivery notifications reduce WISMO call volume by 30–40%. But proactive communication requires predictive visibility — knowing a delivery will be late before the customer does — which loops back to Layers 1–3.
What causes visibility gaps in last-mile delivery?
Last-mile visibility gaps have four structural layers: data fragmentation across 50–200+ carriers with inconsistent tracking capabilities, batch-processed status updates with 15–60-minute data lags, reactive exception handling that responds to failures after they occur rather than predicting them, and disconnected customer communication that generates WISMO inquiries instead of proactive notifications. Only 6% of supply chain leaders report full visibility (Gartner, 2024).
The Cascading Cost: How Visibility Gaps Become a Financial Drain
Each layer of the visibility gap generates its own cost. But the true damage is in the cascade — how these costs compound across the operation.
Visibility Gap Cost Cascade — Enterprise Scale (2M+ Deliveries/Year)
| Cost Layer | Metric | Annual Impact |
| Failed Deliveries | $17.20/package × 8% failure rate (Loqate) | $2.75M+ |
| WISMO Support Overhead | Up to 50% of service volume × $5–8/contact (Narvar, Gorgias) | $400K–$640K |
| Customer Churn & LTV Erosion | 32% leave after one bad experience (PwC); 55% switch for reliability (Capgemini) | Revenue loss (compounding) |
| Combined Annual Drain | Distributed across logistics, service, and marketing budgets | $3M+ (conservative) |
Failed delivery costs. According to Loqate/GBG’s 2023 research, failed deliveries cost an average of $17.20 per package in North America, and approximately 8% of all deliveries fail on the first attempt. For a high-volume enterprise — retail, FMCG, e-commerce, or 3PL — processing two million deliveries annually, an 8% failure rate produces 160,000 failed deliveries at $17.20 each — $2.75 million in direct re-delivery costs alone. With last-mile delivery now consuming 53% of total shipping costs, every failed attempt compounds an already disproportionate cost centre. And this is only the most visible layer.
WISMO support overhead. According to Narvar, WISMO contacts represent up to 50% of customer service volume for some retailers. At $5–8 per interaction (Gorgias e-commerce benchmarks), an enterprise fielding 80,000 WISMO contacts annually — a conservative estimate for high-volume operations — spends $400,000–$640,000 on inquiries that accurate, proactive visibility would have pre-empted.
Customer churn and lifetime value erosion. According to PwC, 32% of customers will stop doing business with a brand after one bad experience. Capgemini found that 55% of consumers will switch to a competitor for more reliable delivery. According to Salesforce’s “State of the Connected Customer” report, 88% of customers say the experience a company provides is as important as its products. The delivery experience, increasingly, is the experience. Bain & Company’s research shows that a 5% increase in customer retention can produce a 25–95% increase in profits — which means the churn driven by visibility-gap failures is not just a customer service problem, it is a revenue problem.
The compound total. Stack re-delivery costs ($2.75M for a 2M-delivery operation), WISMO overhead ($400K–$640K), and the lifetime-value erosion from churn, and the annual drain from visibility gaps exceeds $3 million for a single high-volume enterprise — much of it invisible because it is distributed across logistics, customer service, and marketing budgets. No single dashboard captures the full cost. Which is precisely why it persists.
How much do last-mile visibility gaps cost retailers?
For a high-volume enterprise processing 2M+ deliveries annually, visibility-gap-driven costs include: $2.75M+ in failed delivery re-attempts at $17.20/package and 8% failure rates (Loqate/GBG, 2023), $400K–$640K in WISMO support overhead at $5–8/contact (Narvar, Gorgias), and customer lifetime value erosion where 32% of customers leave after one bad experience (PwC). The combined annual drain exceeds $3M, distributed across logistics, service, and marketing budgets.
Transform Your Supply Chain
Leverage our expertise to streamline your logistics operations and enhance efficiency.
From Tracking to Predictive Visibility: The Technology Shift
Closing the visibility gap requires a fundamental architectural shift — from systems that track delivery status to systems that predict delivery outcomes and intervene autonomously when failures are likely.
Reactive Tracking vs. Predictive Visibility
| Capability | Reactive Tracking | Predictive Visibility (AI-Native) |
| Data Source | Single-carrier status codes | Multi-carrier + external signals (traffic, weather, history) |
| Update Frequency | Batch (15–60 min lags) | Real-time, continuous recomputation |
| Exception Handling | Post-failure logging and re-scheduling | Pre-failure prediction and autonomous intervention |
| Customer Communication | Reactive WISMO responses | Proactive ETA updates, delay notifications, rescheduling |
| Constraint Processing | Package location only | 180+ simultaneous constraints per delivery |
| Outcome | Report on yesterday’s performance | Prevent today’s failures before they happen |
Multi-Signal Ingestion, Not Single-Carrier Tracking
Predictive visibility systems ingest and normalize data from every carrier in the network, regardless of their individual tracking capabilities — GPS feeds, status-code updates, driver telematics, scan events — into a unified real-time picture. Where carrier data is incomplete, the system supplements with external signals: live traffic, weather, historical delivery patterns for that zone and time window, and customer availability probabilities. The goal is a delivery-level prediction model, not a carrier-level tracking dashboard. This is what effective route optimization looks like at enterprise scale — not just planning the shortest path, but dynamically adapting it based on every available signal.
Constraint-Depth Processing for Failure Prediction
Predicting which deliveries will fail requires processing far more than package location. Advanced AI systems evaluate 180+ constraints simultaneously per delivery: current driver position and pace, remaining stops and their estimated durations, real-time traffic on upcoming route segments, weather conditions, historical failure rates for the delivery zone and time window, customer availability patterns, and carrier performance baselines. This constraint depth is what separates systems that can predict a failure 30–60 minutes before it happens from those that report it after the fact. According to McKinsey, real-time visibility of this kind can reduce supply chain disruptions by up to 50%.
Autonomous Intervention, Not Just Alerting
The critical distinction is whether the system can act on its predictions. Passive visibility alerts a dispatcher that a delivery is at risk. Predictive, AI-native visibility autonomously intervenes: rerouting the driver to avoid a traffic delay, reassigning the delivery to a closer carrier with available capacity, sending the customer a proactive delay notification with a revised ETA, or rescheduling the delivery to a time when the customer is more likely to be available. The system doesn’t just see the problem — it solves it. This is what improves fleet utilization at scale: autonomous orchestration that eliminates dispatcher bottlenecks and turns predictive data into real-time action.
Also Read: The Hidden Cost of Failed ETA Promises: How AI Routing Breaks the 95% Accuracy Barrier
Proactive Customer Communication as a System Output
When predictive visibility identifies a likely delay or failure, the system can trigger customer communication before the customer notices the problem — a revised ETA, a rescheduling option, or a proactive apology. According to project44 research, proactive delivery notifications reduce WISMO call volume by 30–40%. The customer experience shifts from reactive (“Where is my order?”) to proactive (“Your delivery is now arriving at 3:15 PM instead of 2:00 PM — does that work?”). According to Qualtrics XM Institute, delivery experience is the number-one driver of NPS in e-commerce. Proactive visibility directly protects the metric that drives retention.
How does AI predictive visibility prevent failed deliveries?
AI predictive visibility prevents failures through four capabilities: multi-signal ingestion from all carriers plus external data (traffic, weather, historical patterns), constraint-depth processing evaluating 180+ variables per delivery to predict failures 30–60 minutes ahead, autonomous intervention (rerouting, carrier reassignment, schedule adjustment) without human involvement, and proactive customer notifications that reduce WISMO volume by 30–40% (project44). McKinsey research shows this reduces supply chain disruptions by up to 50%.
What Closing the Visibility Gap Actually Unlocks
Failed delivery reduction. According to McKinsey, real-time predictive visibility can reduce supply chain disruptions by up to 50%. For an enterprise currently losing $2.75M annually to re-deliveries, even a 30% reduction recovers over $800,000 in direct costs — before factoring in downstream savings from reduced WISMO and improved retention. For organisations evaluating route optimization needs, this is the measurable ROI that justifies the architectural shift.
WISMO volume collapse. Proactive notifications driven by predictive visibility reduce WISMO contacts by 30–40% (project44). For high-volume operations, this translates to hundreds of thousands of dollars in support cost savings annually and frees customer service capacity for higher-value interactions.
Customer retention as revenue protection. According to Bain & Company, a 5% improvement in customer retention produces a 25–95% increase in profits. When visibility gaps drive 32% of impacted customers to leave (PwC) and 55% to switch for more reliable delivery (Capgemini), closing those gaps is not a logistics improvement — it is a revenue protection strategy. Qualtrics confirms delivery experience is the top NPS driver in e-commerce. Predictive visibility is the mechanism that protects it.
Operational intelligence as a compounding asset. Every delivery processed through a predictive visibility system generates data that improves future predictions. Failure patterns by zone, time, carrier, and customer type become a continuously refining intelligence layer. Over billions of deliveries, this creates an operational knowledge base that no manual process or basic tracking system can replicate — a system where data becomes context, and context becomes capability. This compounding intelligence also supports sustainable supply chain initiatives by reducing unnecessary re-delivery miles, fuel waste, and carbon output.
Ready to Eliminate Last-Mile Visibility Gaps?
Schedule a demo with Locus’s AI-powered platform for enterprise logistics and see predictive visibility in action.
How Locus Closes the Visibility Gap
The technology to close this gap exists — and Locus delivers it at enterprise scale.
Locus is the AI-powered logistics orchestration platform purpose-built for enterprise-scale operations. Trusted by 360+ enterprises worldwide across retail, FMCG, e-commerce, 3PL, and CPG sectors, Locus enables predictive visibility, autonomous intervention, and cost-efficient delivery optimization across global carrier networks.
What makes the Locus approach fundamentally different:
- AI-native architecture, not a legacy bolt-on. Locus was built from the ground up for predictive, constraint-depth processing — not retrofitted onto a tracking platform. The system evaluates 180+ real-time constraints per delivery, intervening before failures occur.
- 1,000+ global carrier integrations. Multi-carrier data fragmentation — the single biggest structural blind spot — is solved by normalizing signals from GPS, telematics, status codes, and scan events across every carrier in the network into a unified prediction layer.
- 1.5B+ deliveries optimised. The compounding intelligence from processing over 1.5 billion deliveries means Locus’s failure prediction models are trained on a data foundation that no greenfield platform can replicate. Every delivery makes the system smarter.
- Autonomous orchestration, not just alerting. Locus doesn’t flag a problem for a dispatcher to solve. It reroutes, reassigns, and communicates proactively — autonomously — at machine speed.
- End-to-end, from dispatch to doorstep. From order allocation and route optimization to real-time tracking, predictive ETAs, and proactive customer notifications, Locus closes the visibility gap across every mile — not just the last one.
For enterprise logistics leaders managing $150M+ operations across North America, Europe, Southeast Asia, India, and MEA, Locus is the platform that transforms tracking data into predictive action at scale.
Why Locus? Predictive Visibility vs. Legacy Tracking Systems
| Capability | Legacy Tracking Systems | Locus AI-Powered Platform |
| Architecture | Bolt-on tracking layer on legacy TMS | AI-native, built for predictive orchestration |
| Carrier Coverage | Limited integrations (50–300) | 1,000+ native carrier integrations |
| Constraint Processing | Location-only | 180+ real-time constraints per delivery |
| Failure Response | Reactive (post-failure alerts) | Predictive (30–60 min advance intervention) |
| Customer Communication | Manual/triggered by support contact | Automated proactive notifications |
| Scalability | Degrades under peak volume | Proven at 1.5B+ deliveries |
| Enterprise Trust | Varies | 360+ enterprises globally |
Unlock AI Possibilities
Explore how AI can transform your supply chain operations.
The Gap Is Not Data. It Is Architecture.
Most high-volume enterprises — whether in retail, FMCG, e-commerce, 3PL, or CPG — are not short on tracking data. They are short on the architecture to turn that data into predictions, and those predictions into autonomous interventions, in real time across every delivery in the network. The visibility gap is not about seeing more. It is about acting faster.
The four structural layers of the gap — data fragmentation across carriers, batch-processing lags, reactive exception handling, and disconnected customer communication — demand an AI-native platform that processes 180+ constraints per delivery, predicts failures before they happen, intervenes autonomously, and communicates proactively with customers. With only 6% of supply chain leaders at full visibility (Gartner) and visibility ranking as the second-highest pressure point (13.5%) for last-mile operators, the competitive window for enterprises that act now is significant.
The organisations deploying predictive visibility architecture are seeing measurably different outcomes: 30–50% reductions in delivery disruptions (McKinsey), WISMO collapses of 30–40% (project44), and retention-driven profit gains of 25–95% (Bain & Company). Those still relying on tracking-as-visibility are funding a multi-million-dollar gap they may not even see on any single dashboard.
The question is not whether your team can track packages. It is whether your system can predict which ones will fail — and prevent it before the customer ever knows there was a problem.
Frequently Asked Questions (FAQs)
What is a last-mile visibility gap?
A last-mile visibility gap is the difference between tracking package location (passive visibility) and predicting delivery outcomes in real time (active/predictive visibility). According to Gartner (2024), only 6% of supply chain leaders have achieved full visibility. Most systems can show where a package is but cannot predict which deliveries will fail, intervene autonomously, or communicate proactively with customers before problems occur. This gap has four structural layers: data fragmentation across carriers, batch-processed status updates, reactive exception handling, and disconnected customer communication. For enterprise-scale operations in retail, FMCG, e-commerce, 3PL, and CPG sectors, this gap translates directly into millions in annual losses.
How much do failed deliveries cost retailers and enterprise logistics operators?
According to Loqate/GBG (2023), failed deliveries cost an average of $17.20 per package with approximately 8% failing on first attempt. For an enterprise processing 2M+ deliveries annually, this produces $2.75M+ in direct re-delivery costs. Additional costs include WISMO support overhead ($400K–$640K at $5–8 per contact for up to 50% of service volume, per Narvar and Gorgias) and customer churn where 32% leave after one bad experience (PwC). With last-mile delivery accounting for 53% of total shipping costs, the combined annual drain exceeds $3M at enterprise scale.
What is WISMO and why does it matter for delivery operations?
WISMO (“Where Is My Order?”) refers to customer inquiries about delivery status. According to Narvar, WISMO contacts represent up to 50% of total customer service volume for some retailers, costing $5–8 per interaction (Gorgias). WISMO is a direct symptom of visibility gaps — when customers cannot trust delivery ETAs, they contact support. Research from project44 shows proactive delivery notifications reduce WISMO volume by 30–40%, making predictive visibility one of the highest-ROI interventions for customer service cost reduction.
How does predictive visibility differ from real-time tracking?
Real-time tracking shows where a package is at a given moment. Predictive visibility uses AI to anticipate where a delivery will fail 30–60 minutes before it happens by processing 180+ constraints simultaneously: driver pace, remaining stops, traffic, weather, historical failure patterns, and customer availability. Critically, predictive visibility systems can act autonomously on those predictions — rerouting drivers, reassigning carriers, and sending proactive customer notifications — rather than simply alerting a dispatcher after a failure has occurred.
How does delivery visibility impact customer retention?
Delivery visibility directly impacts retention through three mechanisms. According to PwC, 32% of customers stop doing business with a brand after one bad experience. Capgemini found 55% will switch for more reliable delivery. Qualtrics XM Institute identifies delivery experience as the number-one NPS driver in e-commerce. Bain & Company’s research shows that a 5% increase in customer retention produces 25–95% profit improvement. Closing visibility gaps protects the delivery experience that drives these metrics.
Can AI visibility platforms work with multiple carriers simultaneously?
Yes. AI-native predictive visibility platforms are designed to ingest and normalize data from hundreds of carriers simultaneously, regardless of each carrier’s individual tracking capabilities. They create a unified visibility layer by combining carrier data with external signals (traffic, weather, historical patterns) to produce delivery-level predictions across the entire network. Platforms like Locus, with 1,000+ native carrier integrations, provide a materially broader visibility surface than those limited to a few hundred, which is critical for high-volume operations managing 50–200+ carriers across regions.
What causes last-mile delivery failures due to visibility gaps?
Last-mile delivery failures caused by visibility gaps trace back to four root causes: data fragmentation across 50–200+ carriers that produces an incomplete operational picture, batch-processed status updates lagging 15–60 minutes that prevent real-time intervention, reactive exception handling workflows that only trigger after a failure has already occurred, and disconnected customer communication that fails to proactively notify or reschedule. According to The Last Mile Leaders (2025), carrier performance (11.9%) and visibility (13.5%) are among the top operational pressures, and on-time performance during peak season stands at just 84% (project44, November 2024). AI predictive platforms close these gaps by processing multi-signal data and intervening autonomously before failures materialise.
How can enterprises overcome carrier data fragmentation in the last mile?
Overcoming carrier data fragmentation requires ingesting and normalizing multi-carrier signals — GPS, telematics, status codes, scan events — into a unified real-time view, then supplementing with external data such as traffic, weather, and historical delivery patterns. AI-powered platforms handle 50–200+ carriers regardless of individual API quality or update frequency, creating delivery-level predictions rather than carrier-level dashboards. At enterprise scale, this multi-signal architecture transforms the weakest-link problem — where visibility is only as good as the least-capable carrier’s data feed — into a system where every delivery benefits from the full intelligence layer.
What is the ROI of investing in real-time last-mile visibility?
The ROI is measurable across three dimensions. First, McKinsey research shows predictive visibility reduces supply chain disruptions by up to 50%, translating to $800K+ in recovered re-delivery costs for a 2M-delivery enterprise. Second, proactive notifications cut WISMO volume by 30–40% (project44), saving $120K–$256K annually. Third, retention improvements of even 5% produce 25–95% profit gains (Bain & Company). Additionally, security drives 59% of visibility investments due to theft and damage risks (Tive, 2025), and reduced re-delivery miles support sustainability targets. The compound ROI makes predictive visibility one of the highest-return infrastructure investments in enterprise logistics.

General
How to reduce failed delivery attempts across the Middle East & Africa
Apr 20, 2026
Failed deliveries cost MEA enterprises millions. Learn how AI dispatch orchestration improves first-attempt delivery success across MEA's carrier networks.
Read more
General
From 60-Minute Windows to 15-Minute Precision: A Guide to Predictive ETA Engineering That Actually Works
Apr 20, 2026
A technical guide for supply chain leaders building predictive ETA systems that achieve 95%+ accuracy. Covers data architecture, ML model design, constraint-depth processing, and real-time recomputation.
Read moreInsights Worth Your Time


The Hidden Cost of Last-Mile Visibility Gaps: Why Tracking Alone Can’t Prevent Failed Deliveries