


General
European Retail Supply Chain Analytics in 2026: From Dashboards to Autonomous Orchestration

Key Takeaways
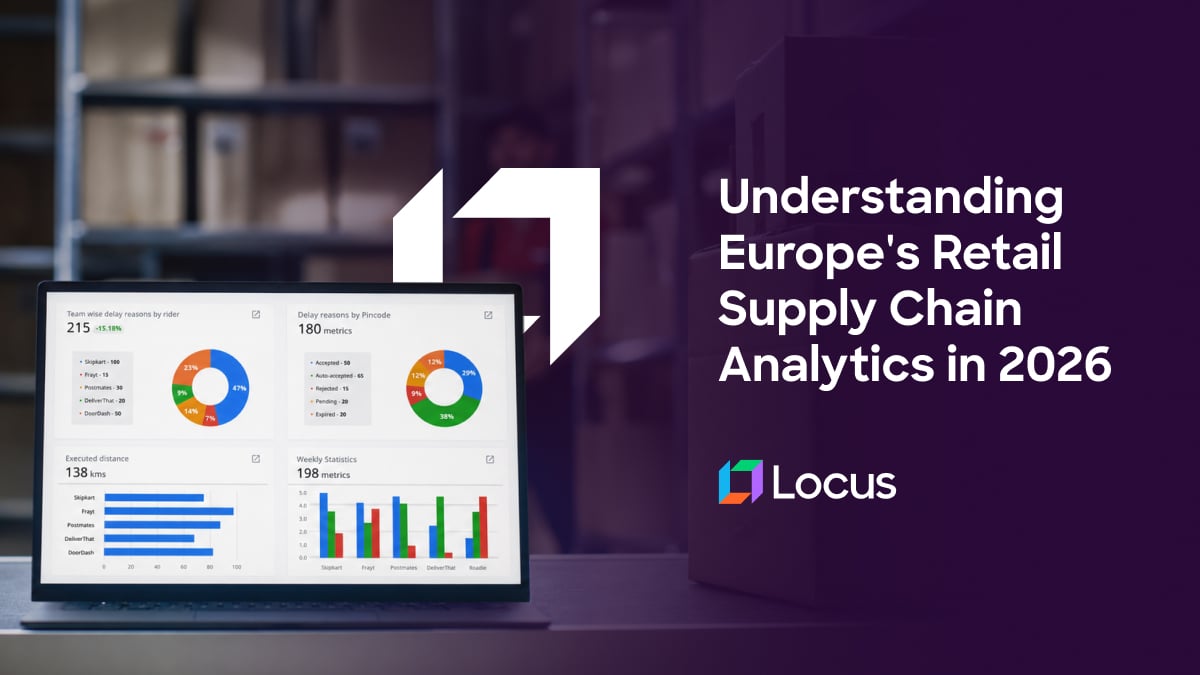
- European retail supply chain analytics is best understood as a three-tier maturity ladder: descriptive analytics (what happened), predictive intelligence (what will happen), and autonomous orchestration (what to do, done automatically).
- Most European retailers are stuck at tier one, with dashboards but no ability to act before exceptions reach the customer.
- The jump to tier two is a data problem before it is a modelling one; predictions fail when built on siloed, per-carrier data.
- Six capabilities move an operation up the ladder: real-time exception detection, predictive ETAs and forecasting, cross-border data unification, an action-linked KPI framework, compliance and carbon on the same spine, and autonomous orchestration.
- The KPIs that matter are OTIF, first-attempt delivery rate, exception resolution time, and cost-to-serve, not vanity metrics.
- Tier three changes the economics by removing the human bottleneck between knowing and doing.
In 2026, the useful way to think about supply chain analytics is as a maturity ladder with three tiers: descriptive analytics that report what happened, predictive intelligence that anticipates what will happen, and autonomous orchestration that acts on it without waiting for a human to read a dashboard.
Most European retail and e-commerce operations sit at the first tier. They have dashboards, weekly reports, and a wall of KPIs, yet exceptions still surface too late to fix, and planners spend their days reacting rather than deciding. The gap between having data and acting on it is where margin leaks, especially across a network that spans multiple countries, carriers, currencies, and post-Brexit customs regimes.
This guide is written for Heads of Supply Chain and retail operations leaders in Europe who own service and cost outcomes. It sets out where the three tiers differ in practice, the six capabilities that move an operation up the ladder, and the operational KPIs that tell you whether the investment is working. The focus throughout is on decisions and outcomes, not tooling for its own sake.
Why Most European Retailers Are Stuck at Tier One
The reason so many operations plateau at descriptive analytics is not a shortage of dashboards. It is that each tier of the ladder demands a different data foundation, and most retailers never build the second one.
Tier one, descriptive analytics, answers what happened. It relies on historical data pulled together after the fact, usually per carrier and per country, and reported on a weekly or monthly cadence. It is useful for board reviews and useless for preventing tomorrow’s failed deliveries.
Tier two, predictive intelligence, answers what will happen. It requires unified, near-real-time data and models that forecast demand, predict ETAs, and flag exceptions before they become customer complaints. This is the jump most retailers stall on, because it depends on data consolidated across the whole network rather than trapped in per-carrier silos.
Tier three, autonomous orchestration, answers what to do about it and then does it. Instead of surfacing an alert for a human to action, the system re-plans routes, reallocates carriers, and resolves exceptions within defined guardrails. Analytics stops being a report you read and becomes a set of decisions the system executes.
The cost of staying at tier one is concrete. A failed delivery in last-mile retail has been estimated at around $17.78 per parcel (OrangeMantra), and in a cross-border European network the multiplier is worse, because a missed customs window or a wrong-country allocation cascades. The six capabilities below are what separate an operation that reports its problems from one that resolves them.
Real-Time Exception Detection Across a Cross-Border Network
The first capability that moves an operation beyond retrospective reporting is the ability to detect exceptions as they happen, not in next week’s report. In a European network, exceptions are not just late parcels. They include customs holds, carrier capacity failures, address issues in unfamiliar markets, and demand spikes that hit one country and not another.
Detection at this level means the system senses the network continuously and compares live status against expected status, so that a deviation raises a flag the moment it appears. This is the sensing capability that everything above it depends on.
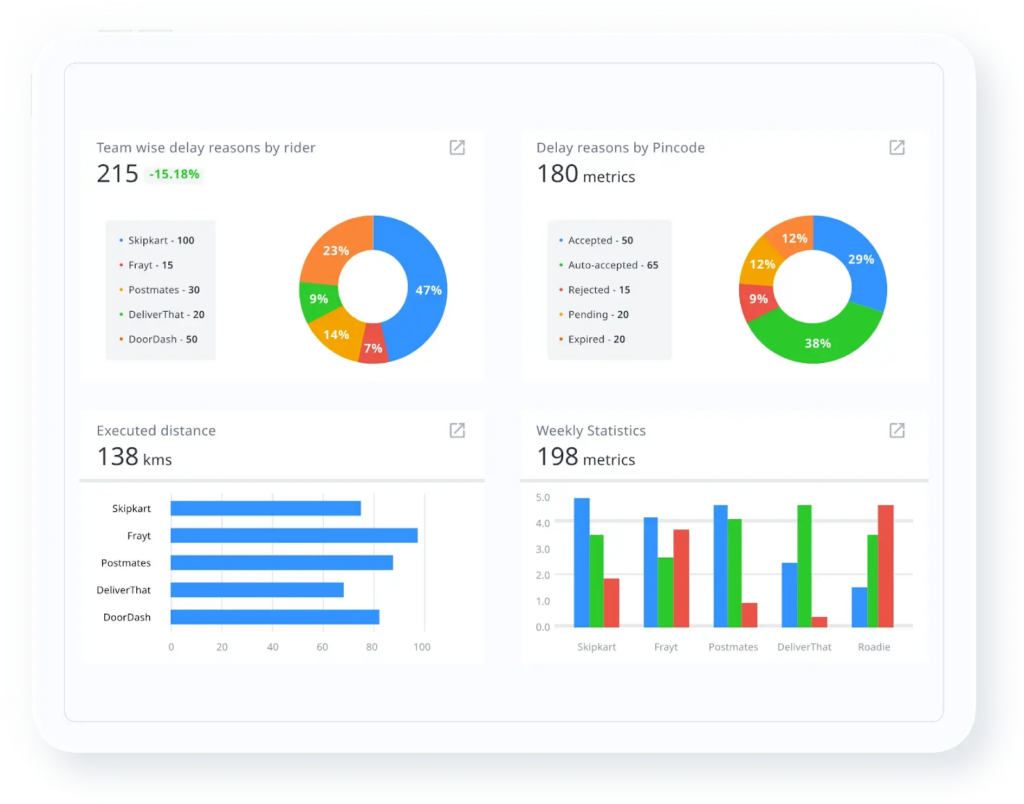
What good looks like for a retail operations leader is a falling exception-to-resolution time and a shrinking share of exceptions discovered by the customer rather than the system. If your customers are still the ones telling you a delivery failed, you are operating below this tier. The measure is simple: what percentage of exceptions does your operation catch before the customer does?
Also Read: How AI Agents Build Self-Healing Supply Chains
Predictive ETAs and Demand Forecasting: The Tier One to Tier Two Jump
Prediction is the capability that defines tier two, and it is where most European retailers stall. Two forecasts matter most for retail operations: the ETA of an individual order, and the demand shape across the network over the coming days and weeks.
Predictive ETAs let an operation set accurate customer expectations and intervene before a delivery slips, rather than apologising after. Demand forecasting lets planners position capacity ahead of peaks, which in European retail means anticipating not one national peak but several staggered ones across markets with different calendars and promotions.
The jump from tier one to tier two is a data jump before it is a modelling one. Predictions are only as good as the unified, near-real-time data beneath them, which is why so many forecasting initiatives disappoint: they are built on stale, siloed inputs. What good looks like is a measurable improvement in forecast accuracy and a fall in both stockouts and last-minute expedited shipping, the two costs poor prediction quietly generates.
Cross-Border Data Unification Across Countries, Carriers, and Currencies
No European retailer runs a single-carrier, single-country network, and this capability is the one most specific to the region. A typical operation spans national parcel carriers, regional hauliers, and gig networks across several countries, each reporting in its own format, currency, and language, with the UK now adding a post-Brexit customs layer.
Unification means bringing all of that into one consistent data model, so that a KPI measured in Germany means the same thing as the equivalent in Spain, and a cross-border shipment is tracked end to end rather than handed between blind spots. Without it, every tier above collapses, because prediction and orchestration cannot work on data that does not reconcile.
What good looks like is a single source of truth for delivery status and cost across the entire network, expressed in comparable terms. The practical test for a retail operations leader is whether you can answer a simple question, such as cost-to-serve by market, without a week of manual reconciliation across carrier portals.
An Action-Linked KPI Framework, Not Vanity Metrics
Analytics maturity is not measured by how many metrics you track. Many retail dashboards are crowded with numbers no one acts on. The capability that matters is a tight KPI framework where every metric is linked to a decision someone owns.
For European retail operations, the KPIs that drive action are on-time-in-full (OTIF), first-attempt delivery rate, exception rate and resolution time, and cost-to-serve by market and channel. Each maps to a lever an operations leader can pull, unlike vanity metrics such as total shipments tracked, which describe activity without informing a decision.
The discipline is to ask of every KPI: if this number moves, who does what? Metrics that cannot answer that question are reporting overhead. What good looks like is a small set of outcome KPIs, each with a clear owner and a clear intervention, reviewed on a cadence fast enough to change the outcome rather than merely record it.
Also Read: From Excel to AI: Three Ways European Retailers Are Cutting Logistics Costs by 15–20%
Compliance and Carbon Analytics on the Same Spine
European retail carries a reporting burden that operations in other regions do not, and a mature analytics capability treats compliance as part of the same data spine rather than a parallel system. The clearest example is carbon: under the CSRD and its ESRS E1 standard, transport emissions must be reported as Scope 3, and building a separate stack to do it is both costly and error-prone.
The capability here is that the same unified network data powering service and cost analytics also produces audit-ready emissions figures, calculated on recognised methodologies such as the GLEC Framework and ISO 14083. One data foundation, several outputs.
What good looks like is that a compliance disclosure becomes a query against data you already maintain, not an annual scramble across carrier spreadsheets. For a retail operations leader this matters because it removes a duplicate data project, and because the same emissions data can feed operational decisions, such as choosing a lower-carbon carrier or consolidating loads, rather than sitting in a report no one uses.
From Insight to Autonomous Action: The Orchestration Layer
The top of the ladder is where analytics stops being something a person reads and becomes something the system does. Tier three, autonomous orchestration, closes the loop between insight and action.
At this level, the system does not just predict that a route will breach its delivery window; it re-plans the route, reallocates the order to a carrier with capacity, or adjusts the schedule, all within guardrails the operation defines. Human oversight remains, but it moves from executing every decision to setting the rules and reviewing the exceptions that matter.
This is the capability European retailers reach last, and it is the one that changes the economics, because it removes the human bottleneck between knowing and doing. A planner can act on a handful of decisions an hour; an orchestration layer acts on thousands.
What good looks like is a rising share of routine decisions handled automatically, a falling manual workload per order, and operations leaders spending their time on strategy and exceptions rather than firefighting. This is the destination the first five capabilities build toward.
Also Read: CFO’s Guide to Green Fleet ROI: EV Cost Parity in Europe
How Locus Makes a Difference
Most analytics platforms help retailers report better. Locus is built for the top of the ladder: autonomous orchestration. As the world’s first agentic Transportation Management System, Locus applies a Sense-Decide-Execute-Learn loop across the network, so the system does not just surface insight but acts on it within defined guardrails, with human-in-the-loop oversight retained.
That capability rests on the DiSCO (Digital Supply Chain Officer) architecture and its team of specialised agents spanning capacity, carrier, dispatch, hub, customer, and settlement decisions, coordinated as one system. The scale behind it is substantial: 1.5B+ deliveries optimised, 360+ enterprise customers, 30+ countries, and a network of 1,000+ carriers, at 99.99% uptime.
The recognition is independent. Locus features in the 2026 Gartner Hype Cycle across AI-powered logistics categories, is a Representative Vendor in the 2026 Gartner MCPMS Market Guide, holds a Leader position in the QKS SPARK Matrix for Transportation Management Systems, and ranks number one for Route Planning on G2, part of seven consecutive years of Gartner recognition.
In practice, one retail enterprise consolidated six legacy systems onto a single platform, cut manual dispatch by more than 80%, sustained on-time delivery above 99%, and reached break-even within the first year. That is the difference between analytics that reports and analytics that runs the operation.
Learn more, visit locus.sh
Frequently Asked Questions (FAQs)
What is supply chain analytics for European retail?
Supply chain analytics for European retail is the practice of turning operational data from a cross-border, multi-carrier delivery network into decisions that improve service and cost. It spans three tiers of maturity: descriptive analytics that report past performance, predictive intelligence that forecasts demand and ETAs, and autonomous orchestration that acts on those predictions automatically within defined guardrails.
What are the most important supply chain KPIs for retail operations?
The KPIs that drive action are on-time-in-full (OTIF), first-attempt delivery rate, exception rate and resolution time, and cost-to-serve by market and channel. Each links directly to a decision an operations leader can own. Vanity metrics such as total shipments tracked describe activity without informing a decision, and add reporting overhead without improving outcomes.
Why do so many European retailers struggle to move beyond dashboards?
Because each tier of analytics maturity needs a different data foundation, and most never build the second one. Descriptive dashboards run on historical, siloed data. Predictive intelligence needs unified, near-real-time data across every country and carrier. Without that consolidated foundation, forecasting and orchestration cannot work, so the operation plateaus at reporting.
How does cross-border complexity affect European supply chain analytics?
A European network spans multiple countries, carriers, currencies, and languages, with the UK adding post-Brexit customs. Data arrives in inconsistent formats, so a KPI in one market may not mean the same in another. Unifying this into a single, comparable data model is a prerequisite for reliable prediction and orchestration across the region.
Can supply chain analytics support CSRD compliance?
Yes. Under the CSRD and its ESRS E1 standard, transport emissions are reported as Scope 3. A mature analytics platform produces audit-ready emissions figures from the same unified network data that powers service and cost analytics, using recognised methodologies such as the GLEC Framework and ISO 14083, rather than requiring a separate reporting stack.
What is autonomous orchestration in supply chain analytics?
Autonomous orchestration is the top tier of analytics maturity, where the system acts on insight rather than just presenting it. Instead of alerting a planner to a delayed route, it re-plans the route, reallocates capacity, or resolves the exception automatically within set guardrails, with humans overseeing rules and exceptions. It removes the bottleneck between knowing and doing.


General
Real-Time Supply Chain Analytics: Transform Your Operations with Data-Driven Insights

Jul 6, 2026
Optimize fleet logistics with real-time supply chain analytics. Learn how predictive delivery intelligence, live KPIs, and multi-fleet visibility cut transit costs.
Read more
General
Route Optimization Software With Real-Time Dynamic Re-Routing: A 2026 Buyer’s Guide
Jul 6, 2026
The seven capabilities that define route optimization software with real-time dynamic re-routing, and how to evaluate them in 2026.
Read moreInsights Worth Your Time


















European Retail Supply Chain Analytics in 2026: From Dashboards to Autonomous Orchestration