General
How Control Towers Are Reshaping Supply Chain Decision-Making: From Dashboards to Orchestration
Key Takeaways
- Most supply chain control towers fail to move operational KPIs because they treat decision-making as a human task rather than an automated function.
- A mature control tower operates across three decision-making layers: strategic network planning, tactical carrier and inventory allocation, and real-time operational orchestration.
- The gap between a visibility tool and an orchestration-capable control tower is whether the system can act on what it detects, without waiting for human intervention.
- AI-powered control towers cut forecasting errors by 20-50% and logistics costs by up to 15%, according to McKinsey research on AI-driven supply chain management.
- Last-mile delivery accounts for 41-53% of total supply chain costs (Capgemini), making it the part of the supply chain where control tower orchestration generates the highest operational ROI.
Most supply chain leaders have already invested in control towers and supply chain decision-making tools. Gartner’s December 2024 survey of 506 supply chain leaders found that advanced data visibility was prioritized last among supply chain technology investments, despite being consistently rated as an aspirational capability.
The gap between aspiration and execution has a specific cause, which is that most control tower implementations stop at the dashboard layer. They show a shipment is late. They do not reroute it. They flag a carrier’s declining performance. They do not reallocate loads.
This article breaks down the decision-making framework separating operational control towers from legacy monitoring tools, introduces a maturity model enterprise logistics leaders can apply immediately, and examines how AI-powered orchestration turns control tower data into execution.
Why Traditional Supply Chain Decision-Making Is Breaking Down
Every enterprise of scale runs on fragmented data. A TMS tracks carrier movements. A WMS monitors inventory and dock activity. An ERP manages financial and order flows. An OMS holds customer-facing fulfillment commitments.
Each system generates accurate, detailed information within its domain. The operational failure: none of them communicates with the others in time for the data to matter.
The decision latency problem
The structural breakdown in traditional supply chain decision-making is not a data shortage. It is decision latency: the time between when a supply chain event occurs and when a logistics leader can respond to it. The economics are specific. Failed deliveries carry a cost of approximately $17.78 per attempt on average.
For an operation running 10,000 daily orders at a 5% failure rate, the annual exposure reaches $4.5 million, before accounting for re-attempt costs, SLA breach penalties, and the customer churn following repeated service failures. A 3PL juggling multi-client carrier networks cannot wait for a morning debrief to reassign shipments after a road closure.
Such decision latency is where margin erosion and SLA failures happen, and it is a structural consequence of siloed systems feeding human decision-makers who lack the time and data resolution to act correctly at speed.
Why fragmented systems compound the problem
Logistics leaders in these environments spend operational hours reconciling data across systems rather than acting on it. Route deviations surfaced in one tool must be cross-checked against OMS delivery windows and TMS carrier assignments before any corrective action is possible.
By the time a decision is made, the delivery window has narrowed or closed. Control towers were built to resolve this architecture. The degree to which they actually do depends entirely on whether they were designed to surface data or to drive action.
What a Supply Chain Control Tower Actually Does and What It Doesn’t

A supply chain control tower is a centralized platform providing cross-function visibility, predictive intelligence, and decision-making functions spanning demand signals, inventory, carriers, and final delivery. The definition, as stated, is correct. As implemented by most vendors, it is insufficient.
The three architectural layers
Every capable control tower operates across three architectural layers.
- The data ingestion layer pulls from carriers, warehouses, order management systems, external variables such as traffic, weather, and port delays, and demand signals, then normalizes that data into a single operational view.
- The intelligence layer processes ingested data through predictive models: flagging at-risk deliveries before they fail, detecting carrier performance degradation before it compounds, and computing dynamic ETAs based on real-time conditions rather than static schedules.
- The execution and orchestration layer acts on intelligence: rerouting deliveries, reallocating carrier loads, triggering customer notifications, and adjusting downstream dispatch plans automatically, within defined operational parameters.
Visibility versus orchestration
The critical distinction in the market is between control towers operating through the intelligence layer and stopping there, and those extending into execution. A visibility-only control tower tells a logistics manager a delivery will miss its SLA window.
An orchestration-capable control tower detects the same risk, computes the optimal corrective route, reassigns the driver, notifies the customer with an updated ETA, and logs the exception for downstream planning, without waiting for human intervention.
To add, real-time communication for delivery fulfillment is a core output of an orchestration-capable system, built into the execution layer rather than retrofitted afterward. For operations running thousands of deliveries per day, the distinction is the difference between proactive management and reactive firefighting.
The Three Layers of Control Tower Decision-Making
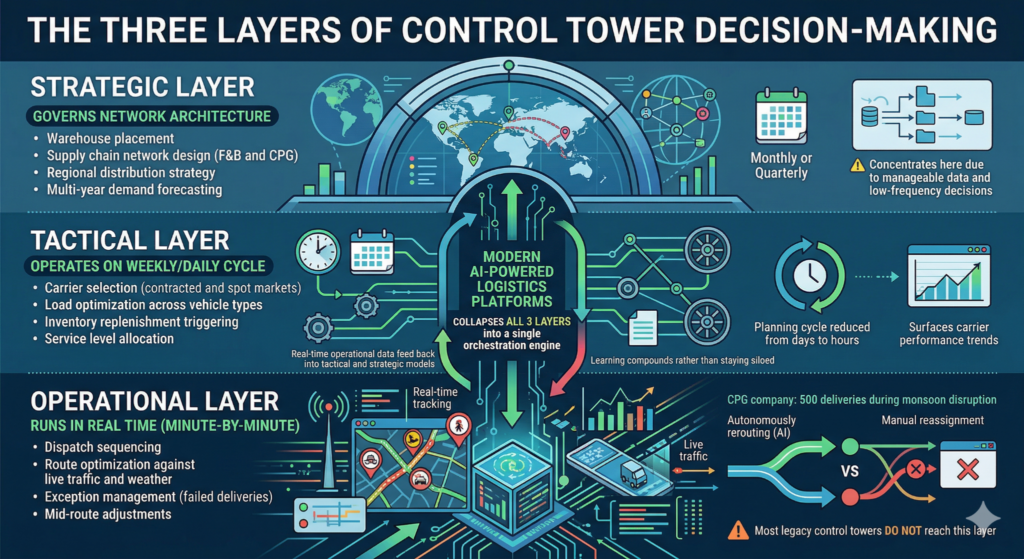
The decision-making scope of a control tower maps directly to three operational horizons. Understanding which horizon your current system operates in is the fastest diagnostic for why visibility investments have not moved operational KPIs.
Strategic layer
Strategic decisions govern network architecture: warehouse placement, supply chain network design for food and beverage and CPG brands, regional distribution strategy, and multi-year demand forecasting models.
Control towers operating at this layer aggregate long-range data to inform decisions made monthly or quarterly. Most legacy systems concentrate here because the data volume is manageable and decisions are low-frequency.
Tactical layer
Tactical decisions operate on a weekly or daily cycle: carrier selection across contracted and spot markets, load optimization across vehicle types, inventory replenishment triggering, and service level allocation across customer segments.
Control towers extending to this layer reduce the planning cycle from days to hours and surface carrier performance trends before they create operational risk.
Operational layer
Operational decisions run in real time, on a minute-by-minute basis: dispatch sequencing, route optimization against live traffic and weather, exception management for failed deliveries, and mid-route adjustments as conditions change. Most legacy control towers do not reach this layer.
A CPG company managing 500 deliveries during a monsoon disruption either has a system autonomously rerouting those deliveries as conditions shift, or it has dispatchers manually reassigning drivers while the delivery window closes.
Modern AI-powered logistics platforms collapse all three layers into a single orchestration engine, feeding real-time operational data back into tactical and strategic models so the learning compounds rather than staying siloed within each horizon.
How AI and Predictive Analytics Elevate Control Tower Intelligence
The AI mechanisms inside an effective control tower are specific. Generic claims about AI-powered supply chains obscure four distinct mechanisms determining whether a system can support autonomous decision-making.
Predictive demand sensing
Demand sensing adjusts delivery schedules based on anticipated order volume spikes before those spikes arrive in the dispatch queue. A retailer heading into a promotional window can pre-position carrier capacity and route density rather than absorbing the surge reactively.
McKinsey’s research on AI-driven supply chain operations documents these outcomes: AI route optimization alongside AI-driven forecasting reduces errors by 20- 50%, with downstream reductions in lost sales of up to 65%.
Dynamic ETA computation
Static ETAs are generated at route creation and never updated. Dynamic ETA computation recalculates arrival times continuously, factoring in live traffic data, driver behavior patterns, weather conditions, and stop-time variance by location type. The output is an ETA narrowing to an accurate window as the delivery progresses, rather than widening into a range, eroding customer confidence.
Anomaly detection
Carrier performance anomalies develop gradually. A carrier running 15-20% slower on a specific corridor over two weeks accumulates a risk the manual review cycle misses until SLA breaches appear in reporting. Anomaly detection flags those patterns early, giving logistics teams time to reallocate loads before the breach occurs rather than after.
Prescriptive recommendations
Predictive intelligence identifies risks. Prescriptive intelligence specifies what to do about them: the optimal carrier-route-time combination for a reassigned load, the delivery sequence that minimizes cost per drop across an adjusted run, and the customer communication timing that retains satisfaction despite a delay.
The difference between alerting and prescribing is where AI in logistics control towers generates measurable ROI.
Control Tower Decision-Making in the Last Mile – Where Orchestration Matters Most
Upstream supply chain control towers address supplier lead times, inventory positioning, and manufacturing throughput. Those functions matter. Last-mile delivery is where they reach their operational limit, and where decision density is highest.
No other part of the supply chain concentrates this much cost exposure into decisions requiring split-second execution, across thousands of individual deliveries, simultaneously.
What mature last-mile orchestration looks like
A mature control tower in last-mile operations processes each delivery against real-time variables, like traffic, new order additions, cancellations, vehicle capacity shifts, and customer availability windows. It assigns the right order to the right vehicle at the right time, continuously throughout the delivery run.
Automated route planning feeds back into the control tower as each stop is completed, enabling mid-route recalculation, recovering time lost to unexpected delays rather than carrying that deficit across the remaining stops.
Locus’s dispatch management engine processes delivery variables at order-level granularity – weight, time window, vehicle class, regulatory constraints, and historical stop-time data – across thousands of deliveries simultaneously.
Routes are generated in seconds. Real-time tracking feeds back into the orchestration layer, enabling mid-route adjustments automatically. Operations across retail, FMCG, e-commerce, 3PL, or CPG using Locus’s logistics orchestration capabilities have achieved up to 45% more deliveries per day from the same fleet, a 38% reduction in WISMO contacts, and delivery cost reductions of 15-30% in year one.
Achieving this requires more than a routing tool. It requires connecting the dispatch engine to the control tower, converting every exception into an automated response rather than a manual task.
See how Locus approaches last-mile excellence through better-connected logistics teams.
From Reactive Dashboards to Proactive Decision Engines: The Maturity Curve
Most enterprise supply chain operations sit at Stage 2 of the maturity curve below. Understanding the gap between the current stage and Stage 4 explains why visibility investments frequently fail to improve operational KPIs.
| Stage | State | Decision-making model | Technology profile |
|---|---|---|---|
| 1: Fragmented visibility | Data exists in disconnected systems | Fully manual, delayed | Spreadsheets, disconnected TMS/WMS |
| 2: Centralized monitoring | Single-pane dashboard aggregates data | Human-driven, reactive | Visibility tools, BI dashboards |
| 3: Predictive alerting | System identifies risks before they materialize | Human-driven, faster | Rule-based alert engines |
| 4: Autonomous orchestration | System makes and executes decisions within parameters | Automated, with human exception oversight | AI-powered logistics orchestration |
Stage 2 is where most enterprise teams stall after a control tower deployment. The dashboard is populated. The data is aggregating. KPIs are unchanged because the system surfaces problems without resolving them.
Stage 3 accelerates human response times but introduces notification fatigue: planners receiving dozens of alerts per hour calibrate quickly to ignore them.
Understanding last-mile technology adoption at your current maturity stage determines where the highest-ROI investment sits.
The Stage 3 to Stage 4 gap
Stage 4 is the only model removing the latency gap entirely. Leading AI-powered platforms at this stage execute decisions within defined operational parameters autonomously, logging exceptions for human review rather than requiring human approval for every corrective action.
The clearest dividing line between Stage 3 and Stage 4 is not data quality or integration depth. Both stages process the same incoming data. Stage 3 creates an alert and stops. Stage 4 generates the corrective action and executes it. For operations running at scale, the single difference compounds across thousands of daily decisions into the KPI movement Stage 2 and Stage 3 cannot deliver.
What to Look for When Evaluating a Control Tower for Decision-Making
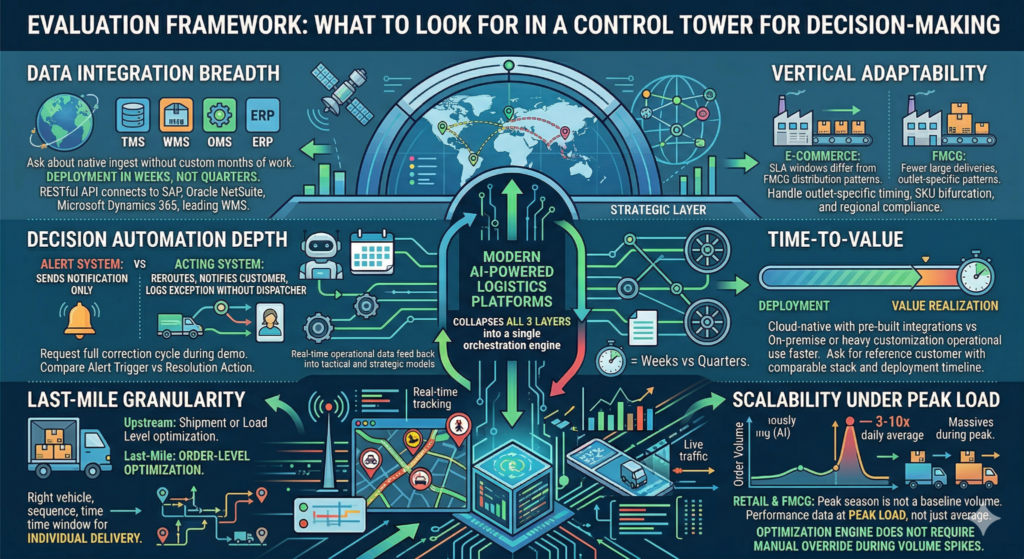
Evaluation criteria for control towers fall apart when treated as a feature checklist. The right frame is whether the system reduces decision latency, and at which layer of the three-horizon framework.
Data integration breadth
A control tower is only as good as its data sources. Ask whether the system ingests natively from your existing TMS, WMS, OMS, and ERP without requiring months of custom integration work.
Locus’s platform connects via RESTful APIs with SAP, Oracle NetSuite, Microsoft Dynamics 365, and leading WMS systems, enabling deployment in weeks rather than quarters.
Decision automation depth
The evaluation question is whether the system alerts or acts. An alerting system sends a notification when a delivery is at risk of missing its SLA window.
An acting system reroutes the delivery, notifies the customer, and logs the exception, without a dispatcher in the loop. Ask vendors to demonstrate the full correction cycle during a demo. Request the alert trigger and the resolution action side by side.
Last-mile granularity
Supply chain control towers designed for upstream logistics optimize at the shipment or load level. Last-mile orchestration requires order-level optimization: the right vehicle, the right sequence, and the right time window for each individual delivery.
Confirm whether the system can optimize at that granularity under live, dynamic conditions rather than only at route creation.
Time-to-value
Deployment timelines for control tower deployments range from weeks to quarters, depending on the architecture. Cloud-native systems with pre-built integrations reach operational use faster than on-premise or heavily customized implementations. Ask for a reference customer with a comparable tech stack and a documented deployment timeline.
Vertical adaptability
E-commerce SLA windows operate on different constraints than FMCG distribution patterns, including outlet-specific timing, SKU bifurcation requirements, and regional regulatory compliance. A system optimized for one vertical may carry assumptions creating friction in another.
Reviewing SCM strategies for industry leaders provides context on where control tower investments fit within broader supply chain transformation priorities.
Scalability under peak load
Peak season order volumes can run 3-10x above daily averages in retail and FMCG. A control tower performing well at baseline volumes but degrading at peak does not constitute a production-grade deployment. Request documented performance data at peak load rather than average throughput alone, and verify the optimization engine does not require manual override during volume spikes.
Key KPIs Improved by Control Tower Orchestration
Control tower deployments are justified by efficiency targets. The KPIs below represent the measurable outcomes distinguishing a working orchestration deployment from a monitoring investment.
How to read these benchmarks
The figures reflect outcomes from AI-powered orchestration configured at Stage 4 of the maturity curve, across Locus’s deployments in retail, FMCG, e-commerce, and 3PL verticals. Improvement ranges vary based on baseline performance, order volume, and integration depth.
| KPI | What it measures | Outcome with AI-powered orchestration |
|---|---|---|
| On-time delivery rate | Orders delivered within the committed window | Up to 99.5% SLA adherence |
| Cost per delivery | Total logistics spend divided by successful deliveries | 15-30% reduction in year one |
| Deliveries per day | Fleet productivity against fixed asset base | Up to 45% increase using the same fleet |
| WISMO contacts | Customer service inquiries about order status | 38% reduction |
| Carrier allocation efficiency | Accuracy of load assignment to optimal carrier | 72% increase |
| Time under roof | Duration shipments spend in sorting or hub operations | 40% reduction |
| Revenue leakage recovered | Misallocated spend identified and corrected | $288M recovered across customer deployments |
In essence, the most reliable indicator of your likely improvement range is your current SLA breach rate and manual intervention frequency: the higher both are, the larger the gap orchestration closes.
The Control Tower That Drives Decisions
Enterprise logistics leaders who have deployed control towers without KPI movement are almost universally at Stage 2: data is aggregating, dashboards are populated, and decisions remain manual.
Locus’s logistics orchestration platform is built for Stage 4, integrating dispatch planning, route optimization, real-time tracking, and carrier orchestration into a single execution engine acting on supply chain data rather than displaying it.
For operations where decision latency is the primary margin risk, schedule a demo with Locus to see how autonomous orchestration operates across dispatch, routing, and fulfillment.
Frequently Asked Questions
What is the difference between a supply chain control tower and a traditional TMS or WMS dashboard?
A TMS optimizes transportation planning within its domain. A WMS manages warehouse inventory and dock activity within its domain. A supply chain control tower ingests data from both systems, plus external variables and processes that data to generate decisions across the full supply chain. The TMS and WMS are input sources. The control tower is the decision layer above them.
How does AI improve decision-making in supply chain control towers compared to rule-based systems?
Rule-based systems execute pre-configured logic: if a delivery is 30 minutes late, trigger an alert. AI-powered systems identify patterns across thousands of variables simultaneously and generate prescriptive actions tailored to specific real-time conditions.
Can a supply chain control tower optimize last-mile delivery operations in real time?
Orchestration-capable control towers process last-mile delivery variables continuously throughout the delivery run. Route recalculation, load reassignment, and customer notification happen automatically as conditions change. The constraint is architectural: a visibility-only control tower cannot execute mid-route adjustments because it has no connection to the dispatch and routing layer. Locus’s dispatch management engine is built with that connection as a core requirement.
How long does it typically take to implement a control tower with decision-automation capabilities?
Cloud-native systems with pre-built API connectors to major TMS, WMS, OMS, and ERP platforms typically reach operational use within weeks. Locus’s cloud-native architecture enables deployment in weeks, and most customers achieve measurable ROI within 6-18 months of going live.
What ROI metrics should enterprises track after deploying a supply chain control tower?
Track the metrics directly reflecting decision latency: on-time delivery rate, cost per delivery, first attempt delivery rate, and WISMO contact volume. Secondary metrics – carrier allocation efficiency, fleet productivity, and hub dwell time, and identify where the orchestration layer is generating the most concentrated value.

General
Retail Logistics Visibility Gaps Are Costing the Industry Billions. Here Is How to Close Them.
Apr 13, 2026
Retail logistics visibility gaps cost $95B/year. See how proactive orchestration eliminates broken handoffs and recovers margin.
Read more
General
The Role of AI in Improving Driver Experience — From Route Fatigue to Retention
Apr 14, 2026
Driver attrition costs fleets millions annually. Discover how AI-powered fatigue-aware routing, cognitive load reduction, and transparent communication improve driver retention without increasing operational costs.
Read moreInsights Worth Your Time


How Control Towers Are Reshaping Supply Chain Decision-Making: From Dashboards to Orchestration