General
Why Supply Chain Disruptions Keep Breaking Enterprise Logistics Budgets
Key Takeaways
- Enterprise logistics cost inflation is structural, driven by compounding disruptions across freight, carrier capacity, and last-mile demand, and it will not normalize on its own.
- Most enterprises undercount the true cost of a disruption by capturing only first-order expenses, missing second- and third-order costs, including SLA penalties, customer churn, and excess safety stock carrying costs.
- The dominant enterprise response, annual carrier RFPs and static route plans, creates decision latency, multiplying cost before a disruption is even fully contained.
- AI-powered logistics orchestration converts disruption signals into immediate dispatch and carrier allocation decisions without waiting for human escalation cycles.
- Retail, FMCG, and 3PL operations each face a distinct disruption cost profile, and the interventions differ by vertical.
Your logistics budget was built for a world where disruptions end. That world does not exist anymore.
Freight surcharges supposed to be temporary are now permanent line items. Carrier capacity tightened during the pandemic has fragmented into a patchwork of regional constraints. Same-day and next-day delivery expectations, once a premium differentiator, are now the baseline against which customers measure every order.
Enterprise logistics cost models were not designed for this. They were built around mean reversion, around the assumption volatility spikes and corrects. The last five years have invalidated it, and the enterprises still budgeting on it are absorbing compounding cost disadvantages their models cannot even see.
This blog breaks down where those costs actually live, why standard planning responses make them worse, and how AI-driven logistics orchestration is enabling a subset of enterprises to convert disruption volatility into a measurable cost control advantage.
The New Cost Reality That Enterprise Budgets Cannot See
Logistics cost models were not wrong when they were built. Annual carrier RFPs, quarterly network reviews, and buffer inventory strategies worked in an environment where disruptions were discrete events with recoverable trajectories. The 2020 to 2025 period proved they are not adequate for persistent, compounding disruption.
The freight rate structure has changed
Container shipping rates serve as the most visible data point.
The Drewry World Container Index spiked roughly ninefold from pre-pandemic levels in 2021, partially normalized through 2023, then climbed again through 2024 as Red Sea rerouting added weeks to trans-ocean transit times and re-congested ports that had just cleared backlog.
The lesson here is not about container rates in isolation. Spot rate volatility is the visible layer. The permanent cost is in the surcharge architecture built on top of it.
Fuel surcharges, peak season surcharges, congestion surcharges, and emergency network surcharges were introduced as temporary cost-recovery mechanisms. Most of them are now embedded as standard rate line items. Enterprises renegotiating carrier contracts in 2025 are not negotiating against a base rate. They are negotiating against a base rate plus a set of permanent additions from disruption cycles and never left.
The nearshoring cost gap
Geopolitical friction has driven a nearshoring and supply chain regionalization wave, most visibly in US-China trade adjustments and European sourcing diversification. The supply chain resilience argument for nearshoring is sound. The logistics cost argument is more complicated. Shorter ocean legs are replaced by longer domestic hauls. Origin-to-destination distances increase. Load factors drop on regional corridors not built for the volume now being demanded.
Nearly half of North American shippers rely on private or dedicated fleets (American Transportation Research Institute, 2024), and those fleets were sized for pre-nearshoring network geometries. They are now running longer routes with lower per-vehicle utilization, generating structural cost inflation invisible in a carrier RFP process.
The last-mile cost floor has moved
With 59% of companies now treating same-day or next-day delivery as a baseline service expectation, the cost floor for last-mile fulfillment has structurally shifted.
Expedited fulfillment is expensive by design. When it becomes the default, an enterprise either absorbs the cost or builds the orchestration capability to deliver it efficiently. Most enterprises have done the first. Few have done the second.
Anatomy of a Disruption’s Cost Impact at Enterprise Scale
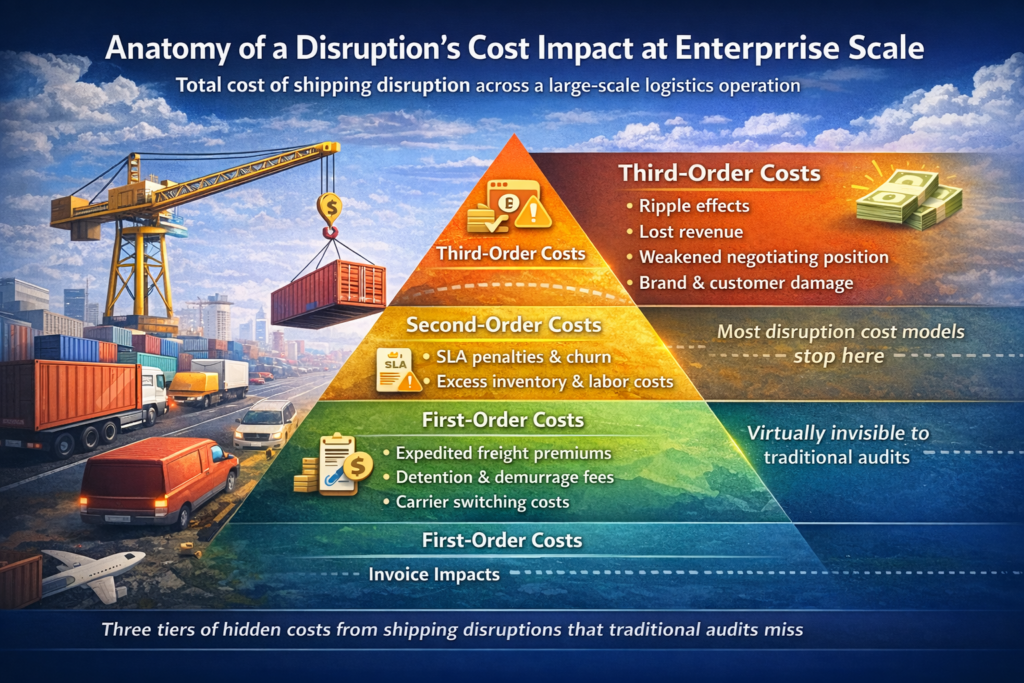
The reason most disruption cost estimates are wrong is not inaccurate spreadsheets. The spreadsheets capture only what is immediately visible on an invoice. A complete cost audit looks different, and it requires a three-tier framework to construct accurately.
Consider a retail enterprise running 50,000+ daily shipments facing a five-day regional port congestion event. The costs it counts are not the costs it pays.
First-order costs
These are what the finance team sees within the first billing cycle. Expedited freight premiums for orders rerouted through air or express surface haul. Carrier switching costs when primary carriers are capacity-constrained. Detention and demurrage charges as containers wait for clearance.
For a 50,000-shipment-per-day operation, a single five-day event at a modest cost premium generates a first-order bill in the mid-six figures before the disruption resolves. These costs are documented and real, and still only a fraction of the actual impact.
Second-order costs
These accumulate in the weeks following the event. SLA penalty payments to customers whose delivery commitments were broken. Customer churn from those failures, where repeated delivery misses convert loyal buyers into defected accounts.
Excess safety stock carries costs because the standard response to disruption is to hold more inventory, which generates its own carrying and obsolescence costs. Manual replanning labor hours, where operations teams spend days reconfiguring routes and reassigning drivers across disrupted corridors. The labor overhead of a single major disruption event regularly exceeds the cost of the freight rerouting triggering it.
Third-order costs
These never appear in a post-disruption review. The opportunity cost of shipments delayed past their revenue recognition window. Loss of negotiating position with carriers after a disruption, when the enterprise’s desperation to recover is visible to every carrier in the tender. Brand damage from repeated SLA failures, where customer experience degradation compounds across disruption cycles into a measurable NPS decline and increased WISMO contact volume.
Gartner’s 2024 Supply Chain Technology Survey found 72% of supply chain leaders reported increased disruption frequency over the prior two years, while only 34% reported having cost modeling beyond first-order impacts.
The enterprises controlling logistics costs in volatile markets are the ones modeling all three tiers. Those counting only first-order costs are systematically underpricing disruption risk and under-investing in the capability to absorb it.
Why Static Planning Is the Most Expensive Strategy in Volatile Markets
There are specific mechanics to how static planning converts disruptions into cost, and why the standard enterprise responds to compound losses in specific, measurable ways.
How decision latency multiplies cost
Static plans have built-in response loops. A disruption occurs. A dispatcher identifies it. It escalates to a routing team. Rerouting is calculated manually. It is communicated back to drivers. In a stable environment, this loop takes hours. In a disruption environment, where the congestion event or carrier capacity drop is dynamic and worsening, the loop completes after the optimal response window has already closed.
Automated route planning research has documented this cost multiplier. By the time a manually rerouted dispatch reaches drivers, fuel costs and time penalties are already compounding against the original inefficiency. The cost of the second decision is higher than the cost of the first decision would have been if made at the right time. Decision latency delays recovery. More critically, it actively inflates the cost of every disruption it is applied to.
When visibility cannot make decisions
61% of logistics providers have adopted digital tracking tools, and 49% are integrating warehouse automation (Gartner Logistics Technology Survey, 2024). The adoption curve for visibility is real. The gap between visibility adoption and decision-automation adoption is where cost leakage lives.
Retail logistics visibility platforms generate exception alerts. Those alerts require a human to read them, assess them, decide on a response, and execute the response through a separate system. In a 50,000-shipment operation facing a regional disruption, the alert queue is not five items long. It is thousands of items long, at the exact moment when human capacity to process them is most constrained.
Visibility without decision-making capability is an expensive observation. The observation is accurate. The response is slow and inconsistent.
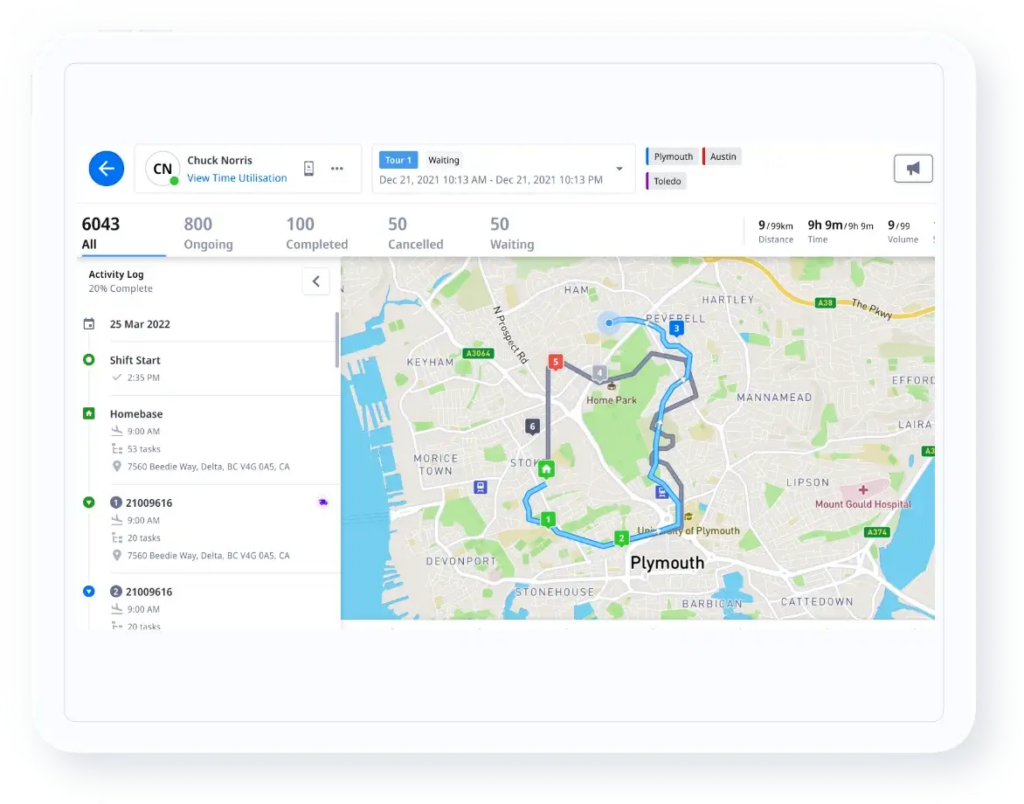
Locus closes this gap by feeding visibility signals directly into its Decision Intelligence Loop, where dispatch, carrier allocation, and load optimization adjust within parameters operations teams define and govern. The human stays in control. The system eliminates the latency between seeing a problem and acting on it.
How AI-Driven Orchestration Converts Disruption Into Cost Control
The gap between enterprises absorbing disruption costs and those controlling them is primarily a decision-making gap. Data availability has improved across the industry. The gap is in what happens to the data once it arrives.
A single decision-making system
The enterprises achieving measurable cost control under disruption conditions are deploying a unified system responding across dispatch and carrier dimensions simultaneously, rather than separate tools for each execution layer.
Locus’s AI route optimization engine operates across 180+ variables simultaneously, recalculating delivery sequences and carrier assignments the moment disruption signals arrive, whether those signals are traffic pattern changes, weather alerts, or capacity constraint notifications from a carrier.
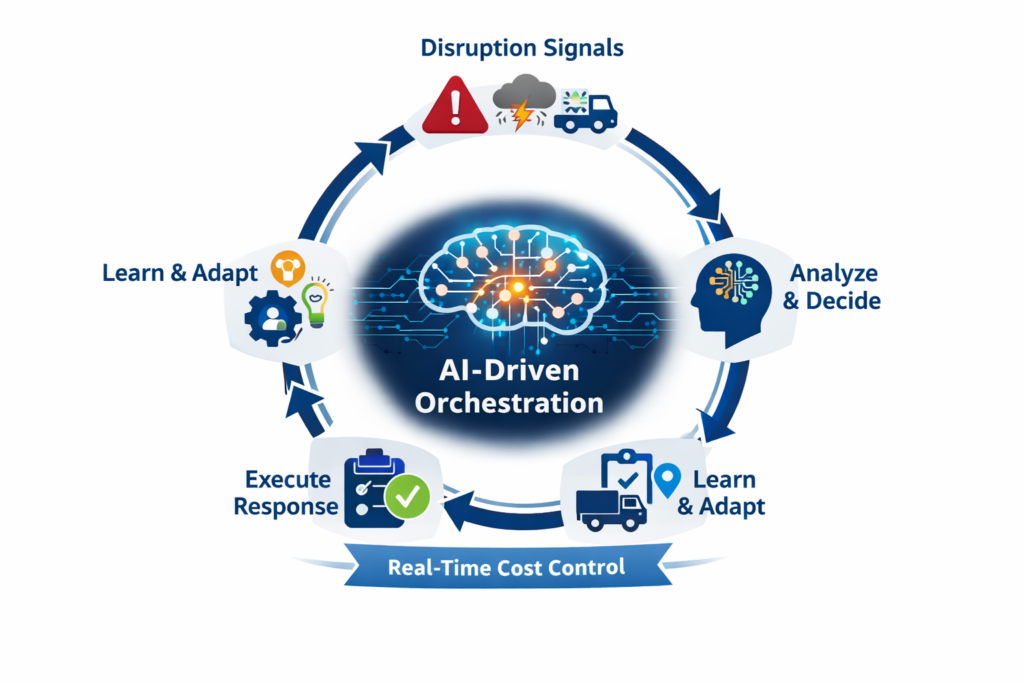
The system does not wait for a human to identify the problem, assess its scope, and initiate a replanning cycle. It senses the signal, decides the optimal response across the full dispatch pool, executes the changes, and learns from the outcome to improve future responses.
Locus describes this as the Decision Intelligence Loop, a cycle sensing disruption signals, deciding the optimal response, executing changes, and learning from each outcome. Each stage completes in minutes rather than hours.
At enterprises processing 50,000+ daily orders, Locus’s platform has produced a 20% reduction in logistics costs while maintaining 99.5% on-time SLA compliance, including during peak disruption periods.
What the numbers mean in dollar terms
A 20% logistics cost reduction at enterprise scale is not a feature benefit. For an enterprise running $50M in annual logistics spend, it is $10M in recoverable cost per year.
For an operation processing 50,000 daily orders, a 99.5% SLA rate means roughly 250 exceptions per day, managed proactively with automated customer notification and rescheduling, rather than a customer service queue absorbing thousands of inbound WISMO contacts.
Locus’s platform has recovered $320M+ in transit cost savings across 360+ enterprise deployments. That figure is not from a single account. It is the aggregate of enterprises replacing static planning cycles with continuous, AI-driven orchestration.
See how Locus’s AI-powered orchestration reduces logistics costs during disruptions. Schedule a demo.
Sector-Specific Supply Chain Disruption Economics
Supply chain disruption costs are not uniform across verticals. The combination of product type, fulfillment model, and customer expectation creates distinct cost profiles calling for different orchestration interventions.
When delivery failure hits customers
For retail enterprises, the last mile is not a logistics metric. It is a customer experience metric.
With 59% of companies treating same-day and next-day delivery as baseline expectations, a disruption that would have been an operational inconvenience five years ago now converts directly to cart abandonment, return rate increases, and repeat purchase decline.
The specific cost mechanism in retail is the NPS-to-revenue chain. A failed delivery attempt costs the direct logistics expense of redelivery. A failed delivery without proactive communication costs a customer relationship. A pattern of uncorrected failures costs a customer segment.
Achieving last-mile excellence in this environment requires real-time exception handling rather than after-the-fact exception reporting.
When perishability amplifies delay costs
FMCG disruption economics differ categorically from general retail because delay costs compound into write-offs. A retail shipment two days late is a customer experience failure. A temperature-sensitive FMCG shipment two days late is a product loss.
Effective supply chain network design for F&B brands requires alternative routing options to be pre-modeled and validated before disruptions arrive, rather than improvised under pressure. Networks optimized for normal-state operations fail quickly under disruption conditions because the primary corridor’s alternatives were never fully costed or mapped.
Unilever’s Southeast Asia operation, processing $4B+ in orders annually across nine countries, reduced unnecessary trips by 10,000+ per month through Locus-powered route and dispatch optimization. Cost recovery at this scale reflects the difference between absorbing network inefficiency and systematically eliminating it through continuous replanning.
Multi-client complexity spreads the cost
3PLs face a disruption cost profile structurally more complex than single-enterprise operations. A disruption does not affect one client contract. It affects every client running freight through the affected corridor, carrier, or facility simultaneously.
The 3PL’s exposure to a disruption is a matrix of multiple client SLA commitments, each with different penalty structures, all drawing on the same pool of drivers and carrier relationships. Manual replanning under these conditions is operationally impossible at scale without systematically missing commitments across multiple client accounts.
Multi-constraint optimization at 3PL scale requires a platform built for exactly this operational profile. Allocating available capacity across client pools in real time, weighted by penalty exposure and carrier availability, across 180+ simultaneous variables, is a decision an orchestration system makes consistently, regardless of disruption load.
Building an Enterprise Disruption-Cost Playbook
Moving from reactive disruption absorption to predictive cost control is an operating model shift. It is also a sequential one. Attempting to automate before establishing visibility produces automation of bad decisions. Attempting to measure before automating produces metrics with no actionable lever attached.
The five phases below are an operating model progression. Skipping phases in either direction compounds the problem.
Instrument your logistics network
Establish real-time visibility across every logistics node and cost driver. This means tracking what carriers are charging, what SLA commitments are at risk, and where capacity constraints are emerging before they become failures, going beyond basic vehicle position tracking.
Locus’s Control Tower provides this visibility layer, aggregating signals across the full dispatch network into a single operational view with predictive SLA breach detection 15 to 30 minutes before a failure materializes.
Build your disruption cost model
Construct cost models capturing first, second, and third-order impacts using the framework from Section 2. The specific figures must be calibrated to the operation, including average cost per failed delivery, average penalty per SLA breach, and average carrying cost per safety stock unit held beyond the optimal level.
Without this model, the automation layer has no cost function to optimize against and produces output that cannot be evaluated against business targets.
Deploy autonomous decision-making
Deploy an orchestration layer to make dispatch and carrier allocation decisions within human-defined cost-service parameters. When choosing enterprise logistics solutions for this phase, the evaluative question should focus on whether the platform can replan routes, reallocate carrier mix, and adjust dispatch sequencing simultaneously across the full order pool in minutes.
Locus’s agentic TMS was built specifically for this operational profile, combining dispatch management and carrier management into a single Decision Intelligence Loop rather than separately managed modules.
Simulate before the disruption arrives
Use scenario planning tools to stress-test network resilience before disruptions occur. The Red Sea rerouting event, the port congestion cycles, and the carrier capacity tightening of 2024 were all foreseeable as scenario types, even if the specific timing was not.
Enterprises running cost-impact simulations of regional disruption scenarios were better positioned to respond when those scenarios materialized. Simulation converts post-disruption learning into pre-disruption resilience.
Measure recovery and optimization rate
Track recovery time from disruption identification to corrected dispatch, cost deviation from planned to actual per disruption event, and optimization capture rate as ongoing KPIs.
Locus’s freight analytics module tracks plan-versus-actual across cost and SLA dimensions continuously. For building supply chain resilience under persistent disruption pressure, measurement is the phase that feeds back into Instrument and Model continuously, closing the loop against a cost structure always shifting.
Stop Absorbing Disruptions and Start Controlling Them
The enterprises widening their logistics cost advantage right now are not operating in less volatile markets. They are operating with a platform converting volatility into a decision rather than a delay.
Locus is built for exactly this environment. Its route optimization engine processes 250+ variables simultaneously. Its Delivery Orchestration module allocates orders across captive, contracted, and outsourced fleets in real time. Its Control Tower surfaces SLA breach risks before they materialize.
Together, they close the gap between seeing a disruption and acting on it, before cost compounds.
For enterprises running tens of thousands of daily shipments across complex, multi-carrier networks, response speed is where the P&L is won or lost.
To learn more, schedule a demo.
Frequently Asked Questions (FAQs)
1. What is the true cost of a supply chain disruption?
Most enterprises capture only expedited freight and carrier switching costs. A complete accounting includes SLA penalty payments, customer churn from failed deliveries, excess safety stock carrying costs, and manual replanning labor overhead. Total disruption cost is typically three to five times the first-order freight figure in the immediate post-event review.
2. How does AI orchestration differ from a standard TMS?
A standard TMS executes predefined routing logic against a static plan. AI-powered orchestration continuously recalculates dispatch and carrier allocation in response to real-time signals, operating within human-defined parameters rather than waiting for exception escalation and manual replanning cycles.
3. Which verticals face the highest disruption exposure?
FMCG operations face the steepest per-unit exposure because product perishability converts delivery delays directly into product loss. Retail operations face high customer-experience costs because delivery failures compound into NPS decline and repeat purchase erosion. 3PLs face the broadest exposure because a single disruption propagates cost overruns across multiple client contracts simultaneously.
4. What is a typical deployment timeline for an enterprise logistics platform?
API-first platforms like Locus achieve initial deployment without requiring a rip-and-replace of existing ERP, WMS, or OMS systems, which reduces the integration timeline significantly compared to legacy TMS deployments.
Most enterprise deployments achieve operational go-live within the first implementation quarter, with optimization performance improving as the system learns from delivery history.
5. What KPIs measure disruption cost control?
Recovery time from disruption identification to corrected dispatch, cost deviation comparing planned versus actual per disruption event, SLA adherence rate during disruption periods, and optimization capture rate are the four metrics distinguishing reactive operations from orchestration-led ones.
Optimization capture rate is the least commonly tracked and the most revealing of how much available cost reduction a platform is actually realizing.

General
Fragmented Logistics Technology Is Cost: A Guide to Strategic Fixes
Apr 1, 2026
Fragmented logistics tech stacks drain $5-15M annually from enterprise margins. Learn why orchestration beats adding more point solutions.
Read more
General
AI Agents in Logistics Are Only as Smart as the Platform Underneath
Apr 1, 2026
Every logistics vendor is launching AI agents. But an agent's output is only as good as the platform underneath it. Here's what to evaluate.
Read moreInsights Worth Your Time


Why Supply Chain Disruptions Keep Breaking Enterprise Logistics Budgets