General
How to Measure and Maximize the ROI of Logistics Technology Investments

Key Takeaways
- Logistics technology ROI spans four financial dimensions: fleet and fuel costs, labor efficiency, SLA compliance, and customer retention, each of which must be baselined before implementation begins.
- Enterprises deploying AI-powered dispatch and route optimization achieve 15-30% delivery cost reductions in year one, compared to single-digit gains from standalone planning tools.
- ROI manifests differently by vertical: retail recovers value through SLA adherence, FMCG through inventory turn velocity, 3PL through multi-client route consolidation, and e-commerce through first-attempt delivery rates.
- A credible business case requires a baseline cost audit, three modeled savings scenarios, and explicit budget line items for integration, change management, and measurement lag.
Most logistics leaders have been in this meeting. A seven-figure technology budget sits on the table, the CFO wants a projected return figure, and the best answer available is “we’ll run more efficiently.” Vague efficiency claims do not survive a board approval cycle.
The difficulty is structural. Logistics technology ROI accumulates across four financial dimensions: fleet and fuel costs, labor and dispatch overhead, SLA compliance and penalty avoidance, and customer retention. Traditional cost-in/cost-out frameworks capture the first dimension at best. The remaining three accrue over 12-24 months, across systems, and through mechanisms a standard finance model cannot trace back to a single technology purchase.
Enterprises measuring ROI correctly are the ones scaling their advantage. The framework ahead quantifies returns across verticals, grounded in real metrics and AI-driven orchestration outcomes from Locus’s deployment base of 1.5 billion+ deliveries across 30+ countries.
Why Logistics Technology ROI Is Harder to Prove Than It Should Be
A standard ROI formula works when costs and savings flow through a single ledger. Logistics technology investments do not work that way. Value accrues across multiple operational layers, on different timelines, and through mechanisms a basic cost model never anticipated.
The staggered savings timeline
Consider a dispatch management deployment. First-year gains show up in fuel consumption and route mileage. By month nine, the data reveals a reduction in failed delivery attempts. By month fourteen, customer retention figures start improving as delivery promise accuracy climbs. A CFO evaluating the investment at month six sees a fraction of the eventual return and may conclude the investment is underperforming, when in fact the more valuable savings categories have not yet had time to materialize.
Fuel savings appear in month two. Labor reallocation appears in month five. SLA compliance penalty avoidance appears in month eight. Customer lifetime value gains appear later still. No standard quarterly review cycle captures this staggered accumulation as a single number, and operations teams that cannot articulate this sequencing upfront will lose the budget conversation before it begins.
The attribution problem
In most enterprise environments, logistics technology sits inside a larger transformation initiative alongside ERP upgrades, fleet replacement programs, and warehouse automation projects. Isolating the contribution of a route optimization or dispatch management layer requires pre-defined measurement baselines, controlled deployment sequences, and granular KPI tracking from day one. Operations teams rarely set these up before go-live, which is why the CFO conversation stalls.
The Core Metrics That Define Logistics Technology ROI
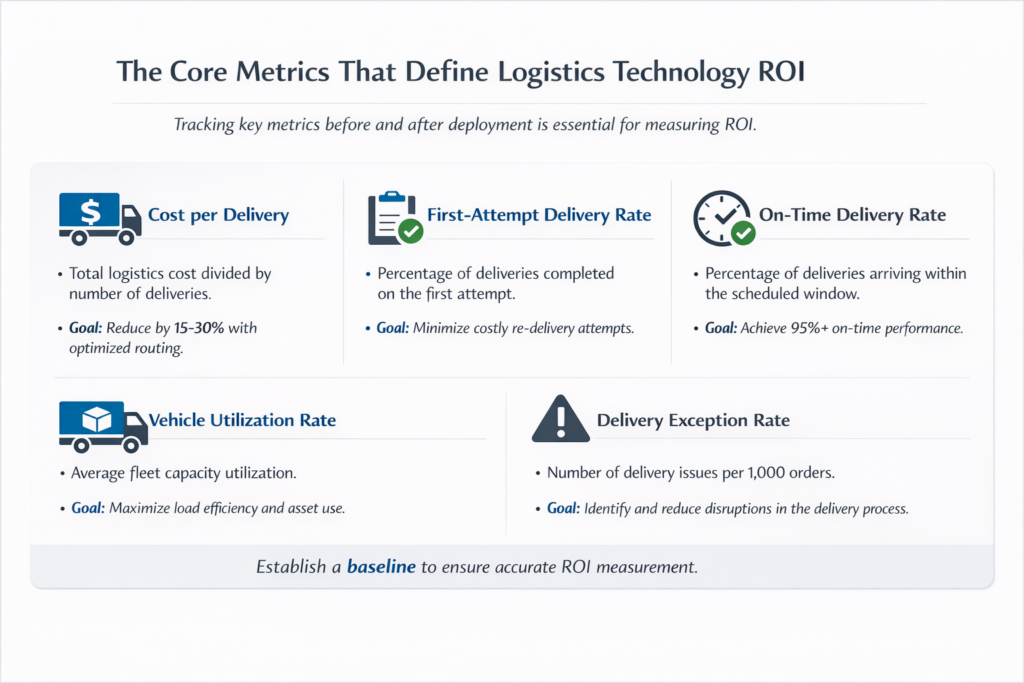
Measuring ROI from logistics technology requires tracking the right indicators before and after implementation. Most enterprises start tracking after. The pre-deployment baseline is where the measurement discipline breaks down, and where most ROI models fail to hold up under scrutiny.
Pulling these KPIs before go-live gives finance and operations a shared language for the ROI conversation and a defensible audit trail when the six-month review arrives.
Cost per delivery
Cost per delivery is the total logistics spend divided by successful completed deliveries. It captures fleet costs, fuel, driver wages, and overhead in a single figure. Enterprises deploying automated route planning reduce this figure by 15-30% in year one, primarily through route mileage compression and improved vehicle utilization.
A FMCG distributor running 3,000 daily drops across a metro region may find 18-22% of its planned routes contain inefficiencies. Unnecessary backtracking, under-loaded vehicles, and stop sequencing errors add 12-18 minutes per route. At scale, those minutes translate directly into driver hours and fuel spend.
First-attempt delivery rate
Every failed delivery attempt costs between $10-$17 per reattempt in direct costs, excluding the downstream customer experience impact. For an enterprise processing 10,000 daily orders, a 5% failed delivery rate generates annual re-delivery costs approaching $4.5 million before accounting for churn (Locus internal benchmarks).
The metric to track is FADR (First Attempt Delivery Rate). Pre-deployment, most enterprises do not know their FADR precisely. Pulling this number from the WMS or OMS before implementation begins is non-negotiable for any credible ROI model.
On-time delivery rate
SLA compliance failures carry direct financial consequences in most enterprise contracts. Retailers issue chargebacks for missed delivery windows, 3PL agreements include service credits, and CPG distribution contracts carry penalty clauses that activate at specific OTD thresholds. The OTD (On-Time Delivery) rate captures all of these in one figure.
Locus’s DispatchIQ module reaches 99.5% OTD across multi-region enterprise deployments. Operations running manual dispatch report OTD in the 80-90% range before AI-driven planning intervention.
Vehicle utilization rate
Under-loaded vehicles are a hidden cost rarely appearing in a monthly P&L review. A fleet running at 65% average utilization carries 35% of its fixed asset cost with no corresponding delivery contribution.
Capacity-aware route optimization, which factors in weight, cubic dimensions, and equipment requirements per stop, systematically closes this gap and captures the return on existing fleet assets before any capital expenditure on additional vehicles.
Delivery exception rate
Exception management is one of the highest-cost failure modes in last-mile operations. The manage delivery exceptions process, when handled manually, requires dispatcher intervention per exception, delays downstream stops, and generates customer contacts at a rate far higher than any SLA model anticipates. Tracking exceptions per 1,000 orders pre-deployment provides the clearest line of sight to where automation will generate returns fastest.
Where AI-Powered Logistics Orchestration Delivers Outsized Returns
Point-solution ROI and platform-level ROI are structurally different. A standalone route optimizer reduces mileage. Locus’s integrated dispatch management, route optimization, and real-time visibility layer generates compounding returns because each module feeds the next, creating a data loop between planning and execution.
Dispatch automation at enterprise scale
DispatchIQ, Locus’s flagship dispatch module, automates order-to-driver assignment across fleets processing thousands of daily orders. Manual dispatch at this volume runs for hours per planning cycle per region. DispatchIQ compresses it to under five minutes and eliminates the assignment errors, driving exception rates up.
Enterprises using DispatchIQ achieve 45% more deliveries per day from the same fleet and a 25% productivity gain across dispatch operations. The productivity gain frees dispatch staff to handle exception management and carrier oversight rather than manual data entry, which is where operational judgment actually belongs.
Dynamic multi-constraint route optimization
Basic route optimizers solve for distance. Locus’s AI route optimization engine accounts for vehicle capacity, time windows, driver skill sets, customer delivery preferences, and regulatory constraints simultaneously, in a single planning pass.
A retailer running 500 daily two-person delivery appointments cannot plan crew pairing, appointment windows, and capacity constraints in a single-variable planner. A two-person crew assigned to a route without accounting for third-floor carry-in requirements misses the delivery, the slot, and the customer. The failed attempt costs the re-delivery fee, the labor for a second visit, and the resulting chargeback. Locus’s multi-constraint optimization accounts for all of these in one pass.
Real-time visibility as a profit driver
Enhanced retail logistics visibility carries a financial case that most operations teams underprice. Locus’s Control Tower module reduces WISMO (Where Is My Order) contacts by 38%, cutting inbound customer service volume and cost-per-contact load on operations teams.
When a deviation occurs, such as a driver running 20 minutes late at stop four, the system flags it, recalculates ETAs for remaining stops, and pushes updated notifications to customers without requiring dispatcher input. A reduction in inbound support contacts of 38% across high-volume operations translates directly to headcount efficiency and customer satisfaction scores.
Platform-level compounding versus point-solution ceilings
A standalone route optimizer delivering a 12% mileage reduction in year one delivers marginal additional gains in year two, once the obvious routing inefficiencies are removed. Locus’s integrated architecture avoids this ceiling.
Dispatch data feeds route optimization. Route optimization data feeds the Control Tower. Control Tower data generates Analytics Studio insights. Analytics Studio insights feed back into the next day’s dispatch decisions. The feedback loop means ROI compounds rather than plateaus. Across multi-year deployments, Locus has generated $320M+ in transit cost savings and reduced total distance driven by 800M+ miles, an accumulation driven by this compounding cycle.
[See how Locus’s AI orchestration delivers measurable ROI across dispatch, routing, and visibility. Schedule a Demo]
Calculating ROI Across Enterprise Verticals
ROI from logistics technology does not manifest identically across industries. The financial levers differ by vertical, and a business case built on the wrong benchmarks will not survive an experienced CFO’s review.
| Vertical | Primary ROI lever | Key metric to track | Locus benchmark |
|---|---|---|---|
| Retail | SLA compliance, failed delivery reduction | On-time delivery rate | 99.5% OTD; 38% WISMO reduction |
| FMCG/CPG | Route efficiency, capacity-aware load planning | Cost per delivery | 15-30% cost reduction in year one |
| 3PL | Carrier allocation, multi-client route consolidation | Carrier allocation efficiency | 72% increase in allocation efficiency |
| E-commerce | First-attempt delivery rate, checkout conversion | FADR | 45% more deliveries per day with the same fleet |
Retail and e-commerce operations share the failed delivery problem but handle it differently. For retail, the financial exposure sits in SLA chargebacks from trade partners. For e-commerce, the exposure is in reattempt costs and customer churn. The vertical breakdown below explains where AI-driven dispatch captures each type of return, and which metrics to watch.
Retail
Retail logistics ROI centers on SLA compliance with retail partners and first-attempt delivery rate with end customers.
Retailer chargebacks for missed delivery windows run at a percentage of invoice value per standard vendor compliance agreements. For a distributor supplying major retail accounts at high annual volume, even a modest chargeback rate generates direct deductions in the millions annually. AI-driven dispatch, improving OTD to 99.5% across those accounts, eliminates most of that exposure.
The second lever is last-mile excellence in consumer-facing delivery. Retailer-branded last-mile operations where tracking is inaccurate or delivery windows are missed, generate NPS deterioration that correlates with repeat purchase suppression. Locus’s consumer-facing tracking and notification layer reduces WISMO contacts by 38%, with delivery speed ranked as a top satisfaction driver by 39% of consumers.
FMCG and CPG
FMCG operations involve high-frequency replenishment routes, fixed delivery schedules, and precise vehicle loading requirements. Route efficiency directly affects product freshness compliance and shelf-ready delivery windows.
The ROI case for FMCG builds around inventory velocity and holding cost reduction. Better supply chain network design and optimized dispatch sequencing reduce the gap between warehouse dispatch and retail shelf availability. At the fleet level, Locus’s capacity-aware routing reduces under-loaded vehicle trips and lowers cost-per-delivery on replenishment runs where margin is thin by design.
For a CPG distributor running 2,000 daily drops across 15 vehicle types with different refrigeration and capacity specs, automated load planning preventing product damage, compliance failures, and manual re-loading labor pays for itself in avoidance costs alone.
3PL providers
Third-party logistics providers operate under a structural constraint where every efficiency gain either feeds margin or enables competitive pricing for client accounts. Visibility-driven cost savings create direct P&L impact.
A 3PL running multi-client operations across a shared fleet must allocate vehicles, drivers, and routes across accounts with different SLA requirements and service windows. Locus’s multi-tenancy architecture handles this without manual allocation overhead, delivering a 72% increase in carrier allocation efficiency that translates directly to reduced client overhead per order and improved drop density on shared routes.
Route consolidation across client accounts generates measurable per-order cost reductions. A 3PL managing five client accounts, each averaging 400 daily orders, consolidates 2,000 daily stops across a unified dispatch plan rather than five separately planned routes. The cost-per-stop difference compounds across 250 operating days.
E-commerce
E-commerce logistics ROI is driven by delivery speed, first-attempt accuracy, and return rate suppression.
Faster deliveries through automated dispatch and dynamic routing reduce cart abandonment at checkout when accurate delivery windows surface during the purchase flow. The direct linkage between reliable delivery promise accuracy and conversion is measurable through checkout flow analysis. Locus’s Delivery Linked Checkout capability integrates the fulfillment engine into the checkout flow, giving customers accurate delivery windows and reducing purchase hesitation.
First-attempt delivery rate is the highest-impact metric in e-commerce operations. A 3% improvement in FADR on 50,000 daily orders eliminates 1,500 reattempts per day. At standard reattempt costs of $10-$17, the annual operational saving runs well into eight figures before accounting for the customer experience benefit.
A Practical Framework for Building the Business Case
Most ROI business cases for logistics technology fail before they reach the CFO’s desk. The most common failure mode is a model built on industry benchmarks rather than the operation’s own cost baseline. A third-party ROI estimate does not constitute a business case for a 3PL running 15,000 daily orders across six regions, because it cannot account for the specific cost structure, fleet composition, and exception rates of that operation.
The four-step methodology below produces a defensible ROI model built on the organization’s own numbers.
Step 1: Baseline audit
Pull the following figures from current TMS, WMS, and finance systems for the last 12 months: total logistics spend, cost per delivery, FADR, OTD rate, exception rate per 1,000 orders, fleet utilization rate, and customer service contacts attributable to delivery failures. If any of these figures are unavailable, the first investment is in measurement infrastructure, because no technology ROI model can stand without them.
Step 2: Identify the primary cost levers
Map each baseline figure to the operational mechanism generating it. High exception rates trace to dispatch sequencing or time window management failures. Low vehicle utilization traces to capacity planning gaps. High cost-per-delivery on short-range routes traces to stop density and route consolidation opportunities. The top three or four levers are where the technology must demonstrate impact, and they should drive the structure of the ROI model.
Step 3: Model three savings scenarios
Build conservative, moderate, and aggressive savings cases across the identified levers. Conservative targets 50% of benchmark improvement rates. Moderate targets 75%. Aggressive targets at or above benchmark. Apply each scenario to a 12-month and 18-month horizon. A credible model shows the CFO a range with clear assumptions documented behind each scenario.
Step 4: Account for full implementation cost
Implementation cost is where business cases most commonly underestimate. Line items include software licensing, integration development connecting the new system to existing TMS, WMS, OMS, and ERP layers, change management and training, and the measurement lag period immediately post-go-live.
Underestimating integration complexity is the most common cause of ROI model failure. An enterprise connecting Locus to SAP S/4HANA, a third-party WMS, and a carrier management system runs three separate integration workstreams simultaneously, each carrying its own timeline, testing requirement, and risk of delay. ROI models also tend to measure too early. The first 60-90 days post-go-live capture teams adapting to new systems. Steady-state performance becomes visible at month three or four, and any ROI review scheduled before then will understate eventual returns.
What 2025-2026 Trends Mean for Logistics Technology ROI
Three developments will reshape how enterprises calculate and capture ROI from last-mile technology over the next 18 months.
Hyper-personalized AI dispatch
AI dispatch is moving from aggregate optimization to individual-level personalization. Rather than assigning delivery windows based on route efficiency alone, hyper-personalized dispatch factors in individual customer delivery behavior, accounting for historical acceptance rates for specific time windows, preference patterns from prior interactions, and real-time availability signals.
Higher first-attempt delivery rates from better window alignment reduce re-delivery costs and customer service load. Locus’s dispatch intelligence already incorporates delivery preference data at the order level, a capability static time-window planners cannot replicate.
Sustainability ROI as a financial metric
CO2e (Carbon Dioxide Equivalent) reduction has crossed from a sustainability report metric to a balance sheet variable. Carbon credit markets, regulatory compliance costs in major markets, and investor ESG scoring increasingly treat emissions reduction as a measurable financial outcome.
Locus’s route optimization has helped enterprises offset 17M+ kg of CO2 across its deployment base, and the system provides per-route emissions data for fleet electrification planning. An enterprise reducing fleet mileage by 15% through route optimization cuts both fuel costs and its carbon credit purchase requirement in markets where emissions trading applies, creating a dual financial return from a single operational change.
Platform convergence
The enterprise logistics software stack is consolidating. Operations running separate TMS, route planning, carrier management, and analytics tools across four vendors face growing integration overhead, data latency between systems, and visibility gaps when handoffs fail.
Single-platform orchestration, where dispatch, routing, tracking, and analytics run on a connected data model, reduces integration risk and accelerates the feedback loop between operational data and planning decisions. Locus already operates at this convergence point. Its six integrated modules cover network planning, dispatch, routing, visibility, hub operations, and customer experience within a unified architecture, without the API overhead of maintaining connections across multiple point solutions.
From Cost Center to Competitive Advantage: Build Your Business Case Now
Enterprises measuring logistics technology ROI across all four financial dimensions, on realistic timelines, with proper baselines, build something competitors cannot quickly replicate: a delivery operation where every cycle feeds better planning, lower cost-per-delivery, and stronger SLA performance.
The gap between a 15% delivery cost reduction and a 30% reduction comes down to orchestration depth. Locus’s dispatch, routing, and visibility modules compound returns rather than plateau them, generating $320M+ in transit cost savings and 20% reductions in ground resource costs across its global deployment base.
Build the business case for AI-powered logistics orchestration with Locus. Schedule a Demo to see the projected ROI for your operations.
Frequently Asked Questions (FAQs)
1. What is the typical ROI timeline for enterprise logistics technology investments?
Positive ROI on logistics technology appears within 6-18 months of deployment, with fuel and route mileage savings materializing first and customer retention gains accumulating over 12-24 months. Timeline varies by deployment scope, integration complexity, and the quality of pre-deployment cost baselines established before go-live.
2. How do you measure the ROI of AI-powered route optimization?
Track cost-per-delivery, vehicle utilization rate, and first-attempt delivery rate before go-live and at 30-, 90-, and 180-day intervals post-deployment. AI-powered route optimization, such as Locus’s DispatchIQ, delivers measurable cost-per-delivery reductions within the first quarter of full deployment.
3. What are the hidden costs reducing logistics technology ROI?
Integration development between the new system and existing TMS, WMS, OMS, and ERP layers adds substantially to initial implementation cost estimates. Change management overhead and a post-go-live performance lag during team ramp-up are the line items most commonly absent from initial ROI models, accounting for more variance in realized returns than the licensing cost itself.
4. How does logistics technology ROI differ between 3PL providers and direct shippers?
For 3PLs, ROI flows through carrier allocation efficiency, route consolidation across client accounts, and multi-client dispatch automation. Direct shippers capture ROI through reduced cost-per-delivery, SLA compliance improvements, and customer retention gains. The AI dispatch core is identical, but the financial model differs by operating structure and margin allocation.
5. Can logistics technology investments deliver measurable sustainability ROI?
Route mileage reduction directly cuts fuel costs and fleet CO2e output. In markets with active carbon trading, emissions reductions generate credit revenue or reduce compliance purchase requirements. Locus’s deployments have offset 17M+ kg of CO2, with per-route emissions data available for fleet electrification planning and a concrete financial measurement framework for sustainability returns.

General
How to Reduce Last-Mile Delivery Costs Without Sacrificing Service Quality
Apr 6, 2026
Reducing last-mile delivery costs without sacrificing quality demands a systematic approach balancing efficiency with customer experience. The most successful strategies blend smart technology, flexible operations, and continuous optimization.
Read more
General
Route Optimization KPIs Every Logistics Leader Should Track
Apr 7, 2026
Discover the route optimization KPIs logistics leaders track to cut delivery costs, improve on-time rates, and drive fleet efficiency.
Read moreInsights Worth Your Time


How to Measure and Maximize the ROI of Logistics Technology Investments