General
The Hidden Cost of Manual Dispatch: Why Mid-Sized Asset-Light 3PLs Can Save $2M+ Annually

Key Takeaways
- Manual dispatch cost doesn’t show up as a single P&L line. It hides across five categories: spot-market premium exposure, allocation labor inefficiency, tender rejection waste, carrier performance leakage, and covered-load margin compression.
- Six operational symptoms tell you whether you have the problem: tender rejection cascades that eat the morning, late-day spot-market spikes, carrier performance blind spots, missed backhaul opportunities, dispatcher overtime as a band-aid, and SLA / customer-scorecard erosion.
- For a mid-sized asset-light 3PL (~$50–200M revenue, ~80–200K loads/year), the combined leak commonly runs $2–4M+ annually when industry benchmarks (DAT spot premiums, McKinsey labor efficiency ranges) are applied across the five lines.
- Baseline before platform. Pull six weeks of allocation data, run the five calculations against it, and identify your two biggest line items before evaluating automation vendors. Baseline-first operations consistently achieve higher realized ROI.
- The strategic question isn’t “which platform?” It’s “what is manual allocation costing us today — and which two P&L lines do we attack first?” The answer to that question determines your shortlist, not the other way around.
A VP of Supply Chain at a Dallas-based asset-light 3PL can describe her manual allocation process in detail. She cannot tell you what it costs. The allocation team covers 1,800 loads per day across the I-35 corridor, Atlanta–DFW lanes, and Phoenix cross-border traffic into Nogales. Covering loads consumes most of every morning. Carrier performance conversations happen quarterly. Spot-market exposure spikes every Monday and after every peak-week. The symptoms are visible. The dollar number isn’t, because “manual allocation cost” isn’t a line item on any P&L.
For a mid-sized asset-light 3PL — roughly $50–200M in revenue, 80–200K annual loads — the cost commonly runs into seven figures. But “what’s it costing us?” is the wrong first question. The right first question is: what are the symptoms telling us, and how do we size the hit?
According to McKinsey, the US 3PL market reached approximately $323 billion in 2023, with domestic transportation management — the brokerage and asset-light segment — among the largest sub-categories. A market that large, running on allocation decisions still made manually at most operators, is where quiet margin loss lives.
This is a diagnostic guide: six operational symptoms that tell you whether you have a manual dispatch problem, and a five-line framework for sizing how big it actually is.
What “Manual Dispatch” Actually Means in Asset-Light 3PL
The phrase needs precision. In asset-heavy trucking, “manual dispatch” means a planner handing work to drivers. In asset-light 3PL, it means something different — and the cost profile is different with it.
The workflow: a load comes in. A planner tenders it to the primary contract carrier. If accepted, covered; if rejected, the planner escalates to secondary. The cascade continues through the tender waterfall — and loads still uncovered by mid-morning get pushed to the spot market at premium rates.
What makes it manual is not the work. It’s that the tender waterfall decisions — which carrier, at what rate, when to escalate, when to go to spot — are made by a planner using email, phone, EDI, and spreadsheets. Not by a system reading live carrier capacity, historical performance, and lane-level pricing simultaneously.
In Sun Belt 3PL operations — DFW, Atlanta, Phoenix — this matters more than in most regions. Freight density is high, carrier turnover is high, and consequences move fast. The number of decisions per shift is large enough that small per-decision inefficiencies compound into large annual costs.
Also Read: Dispatch Automation in Logistics: Complete Guide
Six Symptoms of Manual Allocation Inefficiency
Before quantifying, diagnose. Six operational patterns signal manual allocation is leaking cost — each with a visible operational symptom and a financial consequence.
Symptom 1 — Tender rejection cascades eat the morning. Primary carrier rejects, planner re-tenders to secondary, secondary rejects, cycle repeats. Each rejection consumes 15–45 minutes and ages the load toward spot-market exposure. Symptom: “we spend most of the morning just covering today’s loads.” Financial hit: planner labor on coverage rather than margin-building negotiation.
Symptom 2 — Late-day spot-market exposure. Loads not covered by mid-morning progressively get pushed to the spot market. According to DAT Freight & Analytics, spot-market rates routinely run 10–30% above contract rates in balanced US trucking markets — and the spread can widen sharply in tight markets. Symptom: afternoon spot-market percentage materially higher than morning. Financial hit: margin compression on every spot-covered load.
Symptom 3 — Carrier performance blind spots. Underperforming carriers keep getting tenders because planner “feel” drives allocation — not systematic performance-based routing. Symptom: the same three carriers show up on every customer’s complaint list and somehow stay in the waterfall. Financial hit: SLA penalties, customer-scorecard erosion, and eventually lost accounts at contract renewal.
Symptom 4 — Backhaul and network optimization opportunities disappear. Manual allocation books each load independently. It doesn’t see that two shippers on adjacent Atlanta–Jacksonville lanes could share carrier capacity, or that a DFW outbound could become a Phoenix inbound backhaul. Symptom: carriers complaining about empty miles. Financial hit: weaker carrier retention, worse rates at RFP time.
Symptom 5 — Dispatcher overtime as a band-aid. Manual allocation workload grows with load volume; planner capacity doesn’t. Peaks absorbed through overtime, weekend work, hiring ahead of demand. Symptom: recurring Monday overtime, peak-week exhaustion, turnover in the allocation team. Financial hit: overtime multipliers plus retention and onboarding costs.
Symptom 6 — SLA penalties and customer-scorecard damage. Late covers, wrong-carrier assignments, missed pickups. Every customer scorecard trending down is a revenue-at-risk signal. Symptom: QBRs where scorecard slides take up more agenda time each quarter. Financial hit: penalties today, volume losses at contract renewal tomorrow.
If four or more are visible in your operation, the next section is about sizing the number.
The Quantification Framework: Five P&L Lines Where the Cost Lives
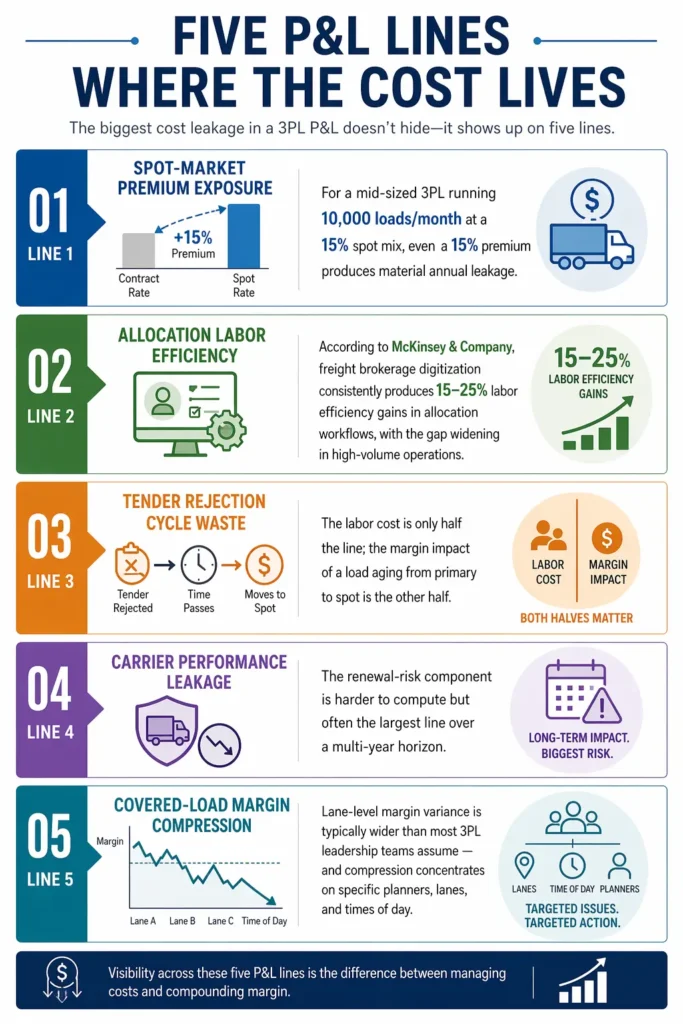
The cost of manual dispatch doesn’t hide. It just lives in five P&L lines, none of which are labeled “manual dispatch cost.” Each line has a defensible calculation — run it against your own data.
Line 1 — Spot-market premium exposure. Calculation: (spot-covered loads per month × premium over contract rate). What to track: your spot-vs-contract mix and per-load premium. DAT and FTR publish benchmark spreads; your own data tells you the true local number. For a mid-sized 3PL running 10,000 loads/month at a 15% spot mix, even a 15% premium produces material annual leakage.
Line 2 — Allocation labor efficiency. Calculation: (hours per load manually allocated × planner rate) – (hours per load under automated tendering benchmark). What to track: minutes per load today. Asset-light operations commonly consume 15–25 minutes per load under manual tendering; automated benchmarks sit materially lower, particularly on contract-carrier volume. According to McKinsey & Company, freight brokerage digitization consistently produces 15–25% labor efficiency gains in allocation workflows, with the gap widening in high-volume operations.
Line 3 — Tender rejection cycle waste. Calculation: (rejected tenders per month × average rejection cycle labor cost) + (aged-load margin impact from delayed coverage). What to track: rejection rate by carrier and by lane. The best carriers reject very few tenders; the worst regularly reject loads on their preferred lanes — a data-visibility failure, not a capacity failure. The labor cost is only half the line; the margin impact of a load aging from primary to spot is the other half.
Line 4 — Carrier performance leakage. Calculation: (loads carried by bottom-quartile carriers × penalty per SLA miss × miss rate) + (scorecard impact on renewal risk). What to track: carrier scorecards at the lane level, not network level. Carriers strong on Atlanta–Charlotte may underperform on DFW–Phoenix; manual allocation doesn’t see the difference. The renewal-risk component is harder to compute but often the largest line over a multi-year horizon.
Line 5 — Covered-load margin compression. Calculation: (covered loads × margin gap vs market benchmark) for loads where planners accepted below-market rates due to incomplete lane pricing visibility. What to track: margin per load by lane, segmented by planner. Lane-level margin variance is typically wider than most 3PL leadership teams assume — and compression concentrates on specific planners, lanes, and times of day.
Putting it together. For a mid-sized asset-light 3PL (~$50–200M revenue, ~80–200K annual loads), running published industry benchmarks across these five lines consistently produces totals in the $2–4M+ range per year. The specific number depends on load mix, lane profile, planner maturity, and carrier network quality — which is exactly why building your own baseline matters more than trusting anyone else’s.
Also Read: 10 Best AI Dispatch Software Platforms (2026 Comparison)
Building the Baseline Before Evaluating Platforms
Three actions before starting any automation platform evaluation.
1. Pull six weeks of allocation data across your top lanes. DFW–Atlanta, DFW–Phoenix, Atlanta–Southeast ports, Phoenix–Southern California — whichever lanes represent your top 70% of volume. Six weeks catches enough variance to be meaningful.
2. Run the five calculations above against that data. Don’t estimate — compute. The ranges the framework produces become your baseline, and the basis against which to evaluate any platform ROI claim. According to Gartner, transportation operations that quantify their baseline before automation evaluation consistently achieve higher realized ROI than those evaluating against vendor-supplied benchmarks.
3. Identify your two biggest line items. For most asset-light 3PLs, spot-market premium exposure (Line 1) and allocation labor efficiency (Line 2) are the two largest — but not always. Some operations are dominated by carrier performance leakage or margin compression. Whichever two your data highlights determines which automation capabilities you prioritize, which vendors make your shortlist, and where your deployment delivers earliest payback.
The Real Question for NA 3PL Supply Chain Leaders
US freight markets swing between contract-favorable and spot-favorable cycles; FTR Transportation Intelligence tracks those cycles and reminds the industry that spot-vs-contract exposure is a moving target, not a fixed condition. That makes continuous measurement of allocation cost more important, not less.
The question asset-light 3PL supply chain leaders should be asking isn’t “which automation platform should we buy?” It is: what is manual allocation actually costing us today, broken down across the five P&L lines — and which two do we attack first?
Platform vendors will happily show you their ROI numbers. The baseline that makes those numbers credible — or exposes them — has to come from your own data.
Frequently Asked Questions (FAQs)
What is manual dispatch in an asset-light 3PL?
In an asset-light 3PL (brokerage or managed carrier network), manual dispatch — more precisely, manual allocation or tendering — is the process by which a human planner matches incoming shipments to contracted carriers using email, phone, EDI, and spreadsheets, rather than relying on automated tendering systems that read live carrier capacity, historical performance, and lane-level pricing simultaneously. The workflow runs through a tender waterfall: primary contract carrier first, secondary if rejected, and ultimately the spot market for loads that remain uncovered.
What are the symptoms of manual allocation inefficiency?
Six operational symptoms indicate manual allocation is leaking cost at an asset-light 3PL. First, tender rejection cascades where the planner spends most of the morning covering the day’s loads. Second, a spike in spot-market percentage later in the day as uncovered loads get pushed to premium rates. Third, carrier performance blind spots where underperforming carriers keep receiving tenders. Fourth, missed backhaul and network optimization opportunities. Fifth, recurring dispatcher overtime and turnover. Sixth, SLA penalties and customer-scorecard erosion.
How do you calculate the cost of manual dispatch at a 3PL?
The cost of manual dispatch at an asset-light 3PL can be quantified across five P&L lines: spot-market premium exposure (spot loads × premium over contract), allocation labor efficiency (hours per load × planner rate vs. automated benchmark), tender rejection cycle waste (rejected tenders × rejection cycle cost), carrier performance leakage (loads with bottom-quartile carriers × penalty per SLA miss), and covered-load margin compression (margin gap vs. market benchmark). For a mid-sized asset-light 3PL, applying published industry benchmarks to these lines commonly produces annual totals in the $2–4M+ range.
What is the difference between manual and automated carrier allocation?
Manual carrier allocation is human-driven tendering using email, phone, EDI, and spreadsheets — planners decide which carrier to tender to, in what sequence, and when to escalate to spot. Automated carrier allocation is system-driven tendering where an allocation engine reads live carrier capacity, historical lane-level performance, cost data, and SLA requirements simultaneously to make per-load carrier decisions. The difference shows up in time-per-load, spot-market exposure, carrier performance discipline, and the ability to see network-level optimization opportunities that manual allocation misses.
What should NA 3PL leaders evaluate before choosing a dispatch automation platform?
NA 3PL supply chain leaders should complete three steps before evaluating automation platforms. First, pull six weeks of allocation data across the top lanes representing 70% of volume. Second, run the five-line quantification framework (spot-market exposure, allocation labor, tender rejection waste, carrier performance leakage, margin compression) against that data to produce a baseline number. Third, identify the two largest line items; those determine which automation capabilities to prioritize, which vendors to shortlist, and where deployment will deliver the earliest ROI.

General
The Hidden Cost of Delivery Slot Rigidity: Why Dynamic Pricing Only Works When Your Routing Data Does
Apr 24, 2026
Learn why dynamic delivery slot pricing fails without accurate routing data, and how real-time capacity and cost insights drive revenue and margin optimization.
Read more
General
The Delivery Promise Paradox: Why UK Retailers Keep Promising Speed Their Networks Can’t Support
Apr 24, 2026
UK retailers promise one-hour delivery their networks can't support. New research shows a 104.5% increase in delays on fast promises — and what's really breaking.
Read moreInsights Worth Your Time


The Hidden Cost of Manual Dispatch: Why Mid-Sized Asset-Light 3PLs Can Save $2M+ Annually