General
Fragmented Logistics Technology Is Cost: A Guide to Strategic Fixes
Key Takeaways
- Enterprise logistics budgets are growing, but fragmented tech stacks turn the investment into compounding cost through integration overhead, data reconciliation labor, and decision latency.
- The average enterprise runs 897 applications with only 29% connected, creating visibility gaps slowing every routing, dispatch, and carrier allocation decision.
- Integration costs alone often exceed the original SaaS licensing fees, with enterprises spending millions annually on custom connectors between tools never designed to interoperate.
- AI-orchestrated logistics technology platforms replace this patchwork by unifying dispatch, routing, visibility, and carrier management into a single decision layer.
Nobody Budgets for the Logistics Tech Stack Problem
Enterprise technology budgets for logistics have never been higher. Operational costs have barely moved. The gap between spending and results reveals a structural flaw most procurement teams overlook.
Budgets are rising
Enterprise logistics spending is accelerating. A 2025 OntegosCloud survey of 900+ supply chain professionals found 38% of freight forwarders and 3PLs plan to allocate more than a quarter of their 2026 budgets to technology. One in three respondents said technology now drives their logistics strategy rather than supporting it.
Operational costs have not dropped to match. U.S. business logistics costs reached $2.58 trillion in 2024, representing 8.8% of national GDP, according to CSCMP’s Annual State of Logistics Report. For individual enterprises, logistics typically consumes 8-14% of revenue depending on industry, fleet model, and geographic spread.
The architecture problem
The disconnect between rising technology investment and stubborn cost structures points to something deeper than a spending problem.
It is an architecture problem. Each tool purchased independently over the past decade, the TMS, the carrier API, the visibility dashboard, and the last-mile routing engine, now operates as a disconnected node in the supply chain. The accumulated weight of those independent purchases has a name worth remembering. Fragmentation debt.
Fragmentation debt is the total cost an enterprise pays, not for its logistics tools, but for the gaps between them. It compounds with each new tool added to the stack and resists incremental fixes that IT teams typically apply. Understanding where the cost accumulates is the first step toward eliminating it.
Anatomy of Fragmentation Costs Beyond Licensing Fees
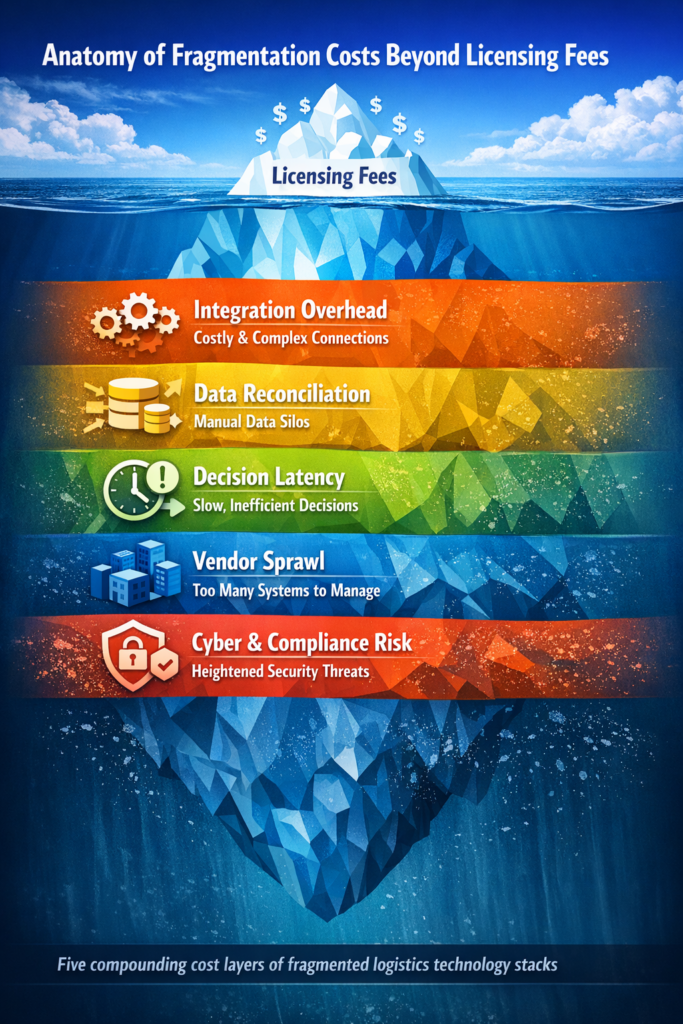
Licensing fees are the visible line item. The real expense lives underneath, spread across five cost layers most enterprises measure poorly or ignore entirely.
Integration and maintenance overhead
When dispatch lives in one system and carrier allocation in another, a connector must bridge the gap. Those connectors require engineering time to build, API version management to maintain, and middleware to keep running. The MuleSoft 2025 Connectivity Benchmark Report, based on surveys of 1,050 IT leaders, found enterprises now manage an average of 897 applications with only 29% integrated.
IT teams spent 39% of their time designing, building, and testing custom integrations between systems. In dollar terms, MuleSoft’s earlier research pegged the average enterprise spend on custom integrations at $4.7 million annually, and IT staffing costs rose 61% year-over-year in 2024, reaching an estimated $16.9 million average.
For logistics operations specifically, the integration burden is acute. A dispatch planning engine must talk to the WMS for order readiness, the TMS for carrier rates, the geocoding layer for address validation, and the tracking system for real-time ETAs. Each connection is a maintenance liability. Each API update from a vendor risks breaking the chain.
Data reconciliation and the trust deficit
When dispatch data lives in one system, real-time tracking in another, and carrier performance in a third, operations teams spend hours each day reconciling conflicting outputs. MuleSoft’s research confirms the pattern.
Among surveyed IT leaders, 90% say data silos create business challenges in their organizations, and only 2% have successfully integrated more than half their applications.
The downstream effect goes beyond wasted labor. Conflicting data erodes trust in analytics. When a VP of Supply Chain cannot confirm whether a metric came from the TMS, the visibility tool, or a manual spreadsheet, the metric loses its authority. Executive decisions slow down because the underlying data requires manual verification before anyone acts on it.
Decision latency
Fragmented stacks cannot support real-time re-routing or dynamic dispatch because no single system holds the full operational picture. A route optimization engine lacking live carrier rate data will produce routes that look efficient on paper but cost more in practice. A visibility tool unable to feed exceptions back into the dispatch layer will generate alerts requiring manual intervention instead of automated correction.
The opportunity cost is measurable. Industry analysis indicates companies implementing predictive analytics in logistics achieve 10-25% reductions in logistics costs and 15-30% improvement in service levels within the first year.
McKinsey’s research on AI in logistics reports early adopters gaining up to 30% efficiency improvements in last-mile delivery. These gains require a unified data substrate. They are structurally unavailable to operations running on four or five disconnected tools.
Vendor management sprawl
Procurement, contract renewal, SLA management, and security auditing across five to 12 logistics software vendors creates a hidden organizational tax. Each vendor requires a relationship owner, a renewal negotiation cycle, an SLA review process, and a security assessment.
The combined overhead rarely appears as a single line item. It is distributed across procurement, legal, IT security, and operations budgets, making it effectively invisible to anyone looking at one department in isolation.
Cyber and compliance risk
Each integration point in a fragmented stack is an attack surface. The OntegosCloud survey exposed a significant blind spot. While 38% of logistics companies are pouring budget into technology, only 11% cited cybersecurity and compliance as a top investment priority.
Budget surges into logistics technology without consolidation expand the threat footprint at the exact moment security investment is lagging. Every unsecured API endpoint, every middleware layer with stored credentials, every data handoff between systems is a potential entry point.
These five cost layers multiply in the long run.
Integration overhead increases the engineering time available for data reconciliation, which slows the decisions that could reduce vendor sprawl, which in turn expands the security surface nobody is budgeting for.
Traditional ROI models evaluating each tool on its individual merits systematically undercount the total cost of ownership because they ignore the interactions between tools.
Why Point Solutions Keep Winning Procurement and Losing Operations
If fragmentation is so expensive, why do enterprises keep adding standalone tools?
Best-of-breed procurement bias
The answer is structural. Procurement processes optimized for “best-of-breed” category evaluation are designed to find the strongest TMS, the most capable route optimizer, and the most accurate visibility tool.
Each evaluation happens in isolation. Each wins on its own merits. The result is a collection of category leaders never designed to work together.
Departmental budget silos
Departmental budgets reinforce the pattern. When the fleet team controls the routing budget and the customer experience team controls the tracking budget, each department selects the tool most aligned with its own KPIs. Nobody owns the integration layer. Nobody measures the cost of the seams between tools.
Speed of tactical purchasing
A VP facing a peak season capacity crunch will approve a carrier management add-on in weeks. The integration debt from the purchase will take months to surface and years to resolve.
Market structure favoring single-domain depth
Many logistics technology vendors offer deep capability in a single domain, such as last-mile visibility, route planning, or freight management. These capabilities are often strong in isolation. The problem is the operating model treating each domain as an independent purchasing decision, producing tech sprawl faster than any integration team can consolidate.
The Orchestration Shift: From Tool Stacking to a Unified Decision Layer
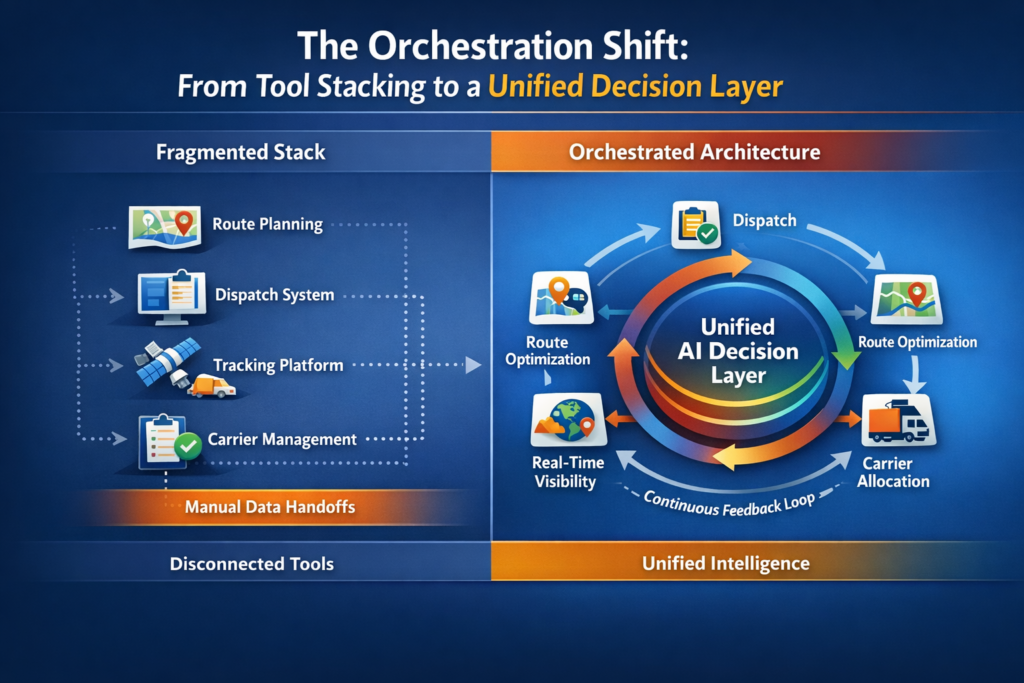
The strategic alternative to tool stacking is logistics orchestration, the architectural principle of unifying dispatch management, route optimization, real-time visibility, and carrier allocation within a single AI-driven decision layer.
One decision engine for all data
Orchestration is a different operating model. Instead of five tools exchanging data through connectors, a single optimization engine draws on a shared data substrate to make every logistics decision. Order grouping, vehicle assignment, carrier selection, route sequencing, and mid-delivery re-routing all run through one engine.
The feedback loop is continuous. An SLA breach prediction at 2 p.m. triggers an automatic route adjustment by 2:01 p.m. because the detection system, the optimization engine, and the execution layer operate on the same data, in the same environment.
AI scenario planning on unified data
AI and ML capabilities become exponentially more useful in this model. Scenario planning for freight cost spikes, demand surges, or geopolitical disruption requires access to dispatch patterns, carrier cost curves, fleet capacity data, and customer delivery preferences simultaneously. A fragmented stack scatters these inputs across three or four databases. An orchestration layer holds them in one.
Multi-modal, multi-region dispatch
Multi-modal, multi-region coordination is a capability emerging only from unified intelligence. Coordinating a pickup by owned fleet, a mid-mile transfer by contracted carrier, and a last-mile delivery by gig partner across two countries requires optimization, accounting for vehicle type, regulatory constraints, customs timing, and customer delivery windows in a single pass. Stitching together regional or modal standalone tools to replicate this coordination produces brittle workflows held together by manual handoffs.
How Locus builds the orchestration layer
Locus’s dispatch management engine, AI-powered route optimization, and supply chain network design capabilities were purpose-built as a single orchestration layer. The system optimizes across 180+ variables simultaneously, including time windows, traffic patterns, driver hours, fleet capacity, fuel costs, customer preferences, and carrier rates.
All are processed in one algorithmic pass rather than sequenced across separate tools. Sequenced optimization (routing first, then carrier selection, then dispatch) produces locally optimal but globally suboptimal outcomes. Simultaneous optimization catches trade-offs that sequential processing misses.
Automated route planning within this architecture reduces dispatcher workload from decision-making to exception handling. Planning cycles drop from hours to seconds. The operational proof across the client base tells the story. 1.5 billion deliveries powered across 30+ countries, $320 million in transit cost savings, and a 99.5% SLA adherence ratio.
Measuring the ROI of Defragmentation: Frameworks for the Enterprise
Quantifying fragmentation cost requires a structured audit that most enterprises have never conducted. Four dimensions matter here, such as:
Total cost of ownership audit
Map every logistics software license, then add the integration cost (engineering hours on connectors, middleware licensing, API management tools), the labor cost (operations staff reconciling data, dispatchers manually bridging system gaps), and the opportunity cost (decisions delayed or degraded by incomplete data). Most enterprises find that the integration and labor layers exceed the licensing layer.
Decision-speed benchmarking
Measure the time from exception detection (a delayed shipment, a carrier cancellation, a demand spike) to corrective action (re-route, re-assign, re-allocate). In a fragmented environment, this cycle involves alerts from the visibility tool, manual assessment by the dispatcher, input into the routing system, and confirmation through the carrier management layer. In an orchestrated environment, the cycle is automated. The delta between these two times, multiplied by exception frequency, quantifies the operational cost of fragmentation directly.
Visibility gap scoring
Measure the percentage of active shipments with origin-to-delivery, real-time status versus partial, delayed, or system-dependent updates. The gap between full visibility and the current state correlates with WISMO (Where Is My Order) call volume, customer satisfaction degradation, and SLA breach rates. Last-mile technology investments are often justified on this metric alone.
ROI timeline modeling
Full platform migration typically yields measurable returns within 12-18 months. Early wins in dispatch efficiency and carrier cost optimization surface within 90 days as the unified optimization engine eliminates the most obvious routing and allocation inefficiencies. For a $1 billion-revenue enterprise, the savings benchmark is $5-15 million annually, representing 50-150 basis points of margin improvement.
Locus clients in retail and FMCG have recorded results consistent with this benchmark. The aggregate record, $320 million in transit cost savings across the client base, including brands such as Unilever, Nestle, and the Tata Group, reflects the compounding effect of unified optimization across dispatch, routing, and carrier selection within enterprise logistics operations.
What the Next Three Years Demand
The convergence of three forces makes the defragmentation window urgent.
Investment is accelerating without consolidation
With 38% of logistics providers pushing more than a quarter of their budgets into technology and 44% prioritizing predictive visibility, spending will continue to rise through 2027. Enterprises channeling those dollars into additional standalone tools will deepen their fragmentation debt. Enterprises redirecting spending toward orchestration will compound their efficiency gains.
Integration complexity is outpacing integration capacity
The MuleSoft 2026 Connectivity Benchmark Report found 88% of organizations are pursuing agentic AI transformation, yet 50% of AI agents already operate in isolated silos. Fragmentation is no longer limited to logistics. It is an enterprise-wide structural risk logistics, with its high transaction volume and tight latency requirements, will feel first.
The competitive gap is widening
Orchestrated enterprises can re-route a fleet in seconds. Fragmented enterprises take hours. Orchestrated enterprises see carrier cost curves, fleet utilization, and SLA compliance in a single view. Fragmented enterprises assemble the view manually, if they assemble it at all. Over three years, the difference compounds into a structural advantage in delivery cost, service reliability, and customer retention.
The question is no longer whether to consolidate. It is how quickly the consolidation generates returns.
Enterprises evaluating their logistics technology consolidation strategy can schedule a Locus demo to see how orchestration replaces fragmentation in practice. Achieving last-mile excellence starts with eliminating the gaps between the tools your team already uses.
Frequently Asked Questions (FAQs)
How much does fragmented logistics technology cost an enterprise annually?
The direct licensing fees are typically the smallest component. When integration maintenance, data reconciliation labor, decision latency, vendor management overhead, and cybersecurity exposure are included, a $1 billion-revenue enterprise can lose $5-15 million annually to fragmentation. MuleSoft’s 2025 research found enterprises spend an average of $4.7 million on custom integrations alone, with IT staffing costs rising 61% year-over-year to support increasingly complex multi-tool environments.
What is the difference between logistics consolidation and logistics orchestration?
Consolidation replaces multiple tools with fewer tools. Orchestration goes further by unifying dispatch, routing, visibility, and carrier management into a single AI-driven decision layer where every function draws on the same data and optimization engine. Consolidation reduces licensing fees. Orchestration eliminates the integration layer entirely and enables real-time, closed-loop decision-making across the full logistics lifecycle.
How long does it take to see ROI from defragmenting a logistics tech stack?
Early wins in dispatch efficiency and carrier cost optimization typically surface within 90 days as the unified engine resolves the most obvious routing and allocation inefficiencies. Full ROI, including labor savings from eliminated data reconciliation and reduced vendor management overhead, generally materializes within 12-18 months.
How many logistics software tools does a typical enterprise use?
Industry reports suggest large shippers operate five to 15 distinct logistics tools across dispatch, TMS, WMS, carrier management, visibility, and last-mile delivery. The MuleSoft 2025 Connectivity Benchmark found that the average enterprise manages 897 applications overall, with only 29% integrated, and organizations deploying AI agents use an average of 1,103 applications.
Why do enterprises keep buying point solutions if fragmentation is so expensive?
Procurement processes optimized for category-level evaluation, departmental budgets with siloed KPIs, and the speed of tactical purchasing all create structural incentives for fragmentation. Each individual tool wins on its own merits during evaluation. The integration cost between tools rarely surfaces until months or years after the purchase decision.
General
10 Best Route Tracking Software for Enterprise Logistics Teams in 2026
Mar 31, 2026
Compare 10 route tracking software for enterprise logistics. Feature breakdowns, pricing, ratings, and use-case fit for retail, 3PL, and FMCG fleets.
Read more
General
Why Supply Chain Disruptions Keep Breaking Enterprise Logistics Budgets
Apr 1, 2026
Enterprise logistics budgets keep breaking under compounding disruptions. See why reactive budgeting fails and how AI orchestration turns volatility into cost control.
Read moreInsights Worth Your Time


Fragmented Logistics Technology Is Cost: A Guide to Strategic Fixes